· Developers · Architects · Investors
Picture this: a developer spends three weeks researching a parcel, hires consultants, and builds a feasibility report. The conclusion? The site can support 40 units. Deal done. Land acquired.
Six months later, a competitor buys the lot next door – nearly identical in size and location – and files permits for 120 units. Same neighborhood. Same zoning district. Three times the density.
What did they know that the first developer didn’t?
The answer isn’t insider information or years of local experience. It’s a deeper understanding of what the zoning actually allows – not just what the surface label suggests. And in 2026, a new layer of state legislation, federal incentive boundaries, and AI-powered analysis tools is making that deeper understanding available to any team willing to look.
Zoning can highlight real estate opportunities months – or even years – before they’re obvious to the broader market. Upzoning can boost land values long before any building permits are filed. The developers who move first are the ones who understand this.
This post walks through five concrete patterns where zoning, legislation, or federal programs allow far more than the market currently prices in – and explains how AI site selection tools are helping developers find these opportunities first.
The Surface Zoning Problem – and Why It’s Costing You Deals
Most development teams do a surface-level zoning check. They confirm the permitted use, note the height limit, and move on. That’s a critical mistake.
The actual development capacity of a parcel is layered. Base zoning is just the starting point. On top of that come overlay districts, density bonuses, FAR calculations, state law overrides, affordability incentive programs, and federal designation boundaries – each one capable of dramatically changing what you’re allowed to build, or how much equity you can raise to build it.
A single municipality can have hundreds of pages of zoning ordinances, dozens of overlay districts, and years of code amendments. Most development teams simply don’t have time to read all of it for every site they’re evaluating. So they stop at the surface. And they miss the density.
Key stat: In 2024, more than 70% of multifamily construction providers reported significant project delays, often beginning in pre-development – frequently caused by zoning and regulatory surprises discovered too late in the process.
The good news: these aren’t unknowable surprises. They’re hiding in publicly available zoning codes, overlay maps, federal designation lists, and state housing laws. They simply take too long to find manually. That’s the gap AI zoning analysis tools are now closing.
Five High-Density Patterns That Look Like Low-Density on the Surface
Here are five of the most common – and most consistently overlooked – patterns where zoning, legislation, or federal incentive programs allow significantly more than the market currently prices in.
Pattern 1: Commercial Zones With Hidden Residential Rights
Many commercially zoned parcels now permit multifamily housing by right, following a wave of state-level zoning reforms. Developers focused on residential pipelines are systematically ignoring these parcels because of their commercial label.
Texas Senate Bill 840, signed into law and effective September 1, 2025, requires municipalities with populations over 150,000 to allow multifamily and mixed-use development by right in any zone that permits office, commercial, retail, or warehouse uses. No rezoning, no variance, no public hearing. The statute sets a minimum density floor – the greater of the city’s highest permitted residential density or 36 units per acre – and removes FAR limits for qualifying developments. In practice, cities like Austin, Dallas, Houston, and San Antonio are all directly affected.
A commercially zoned lot that looks like a retail dead end might actually be one of the strongest multifamily sites in your market. You won’t know unless you check the current code – and most teams don’t.
Pattern 2: State Transit Laws That Now Override Local Zoning
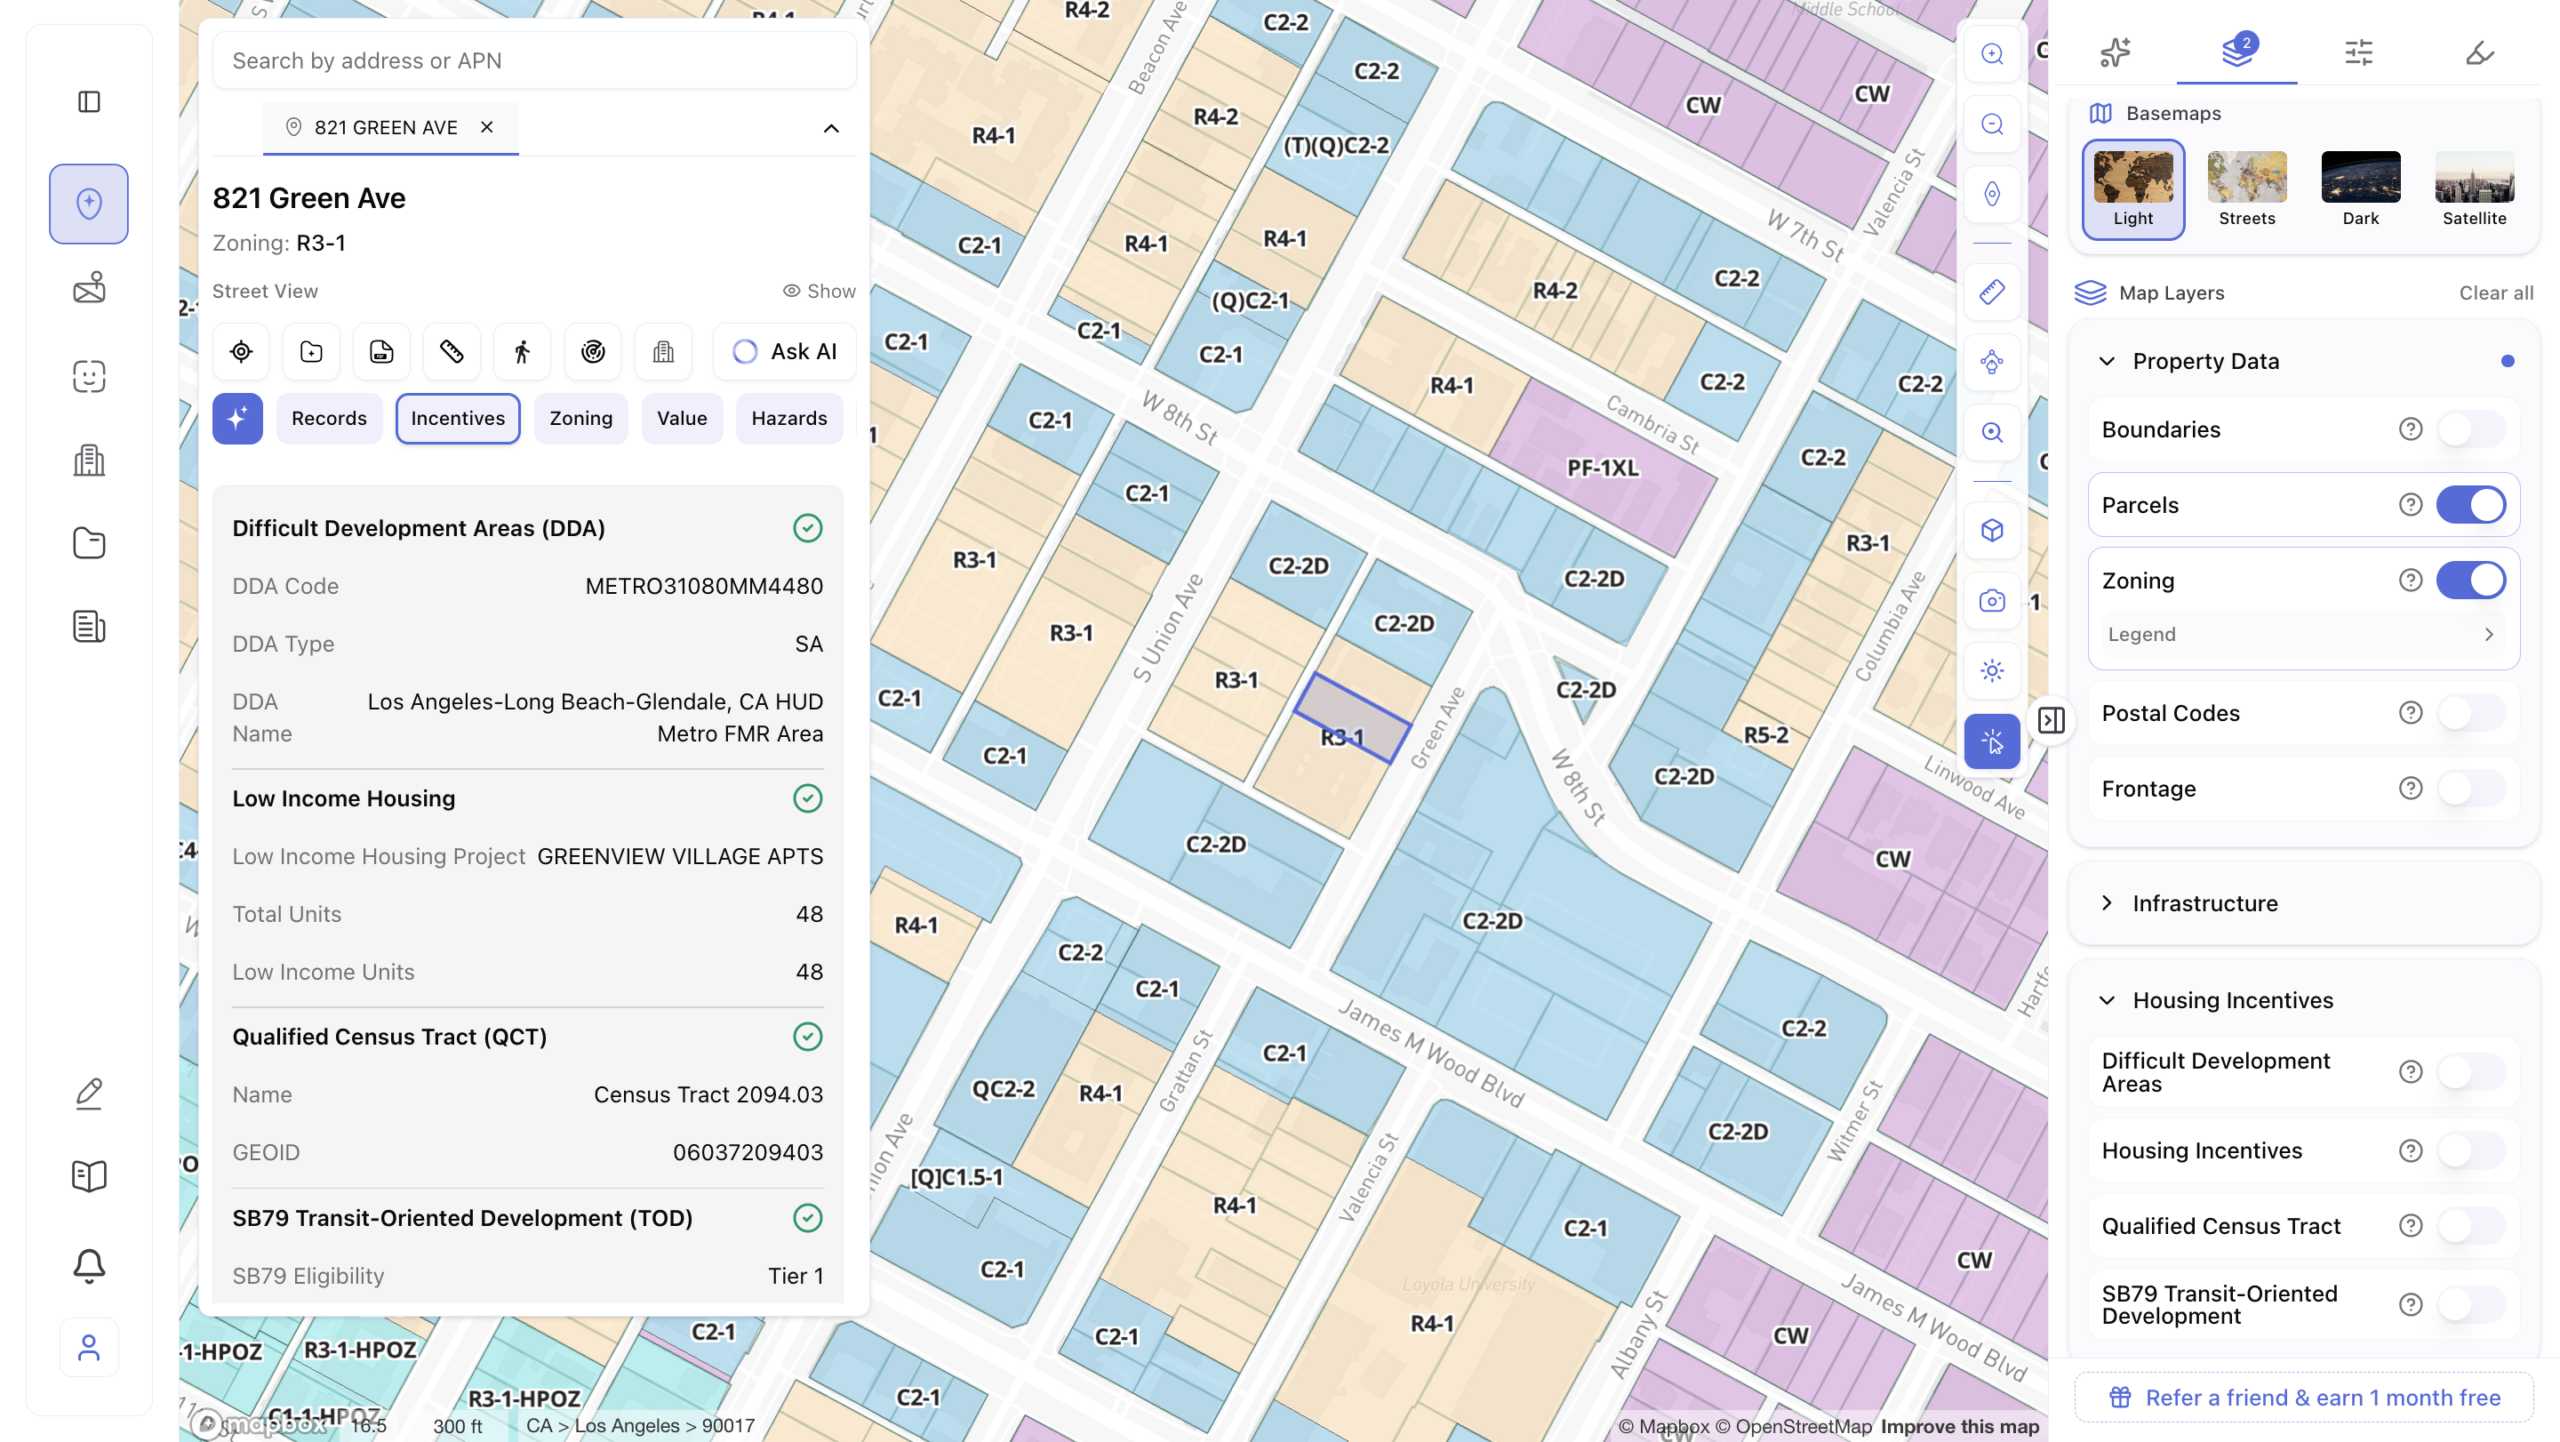
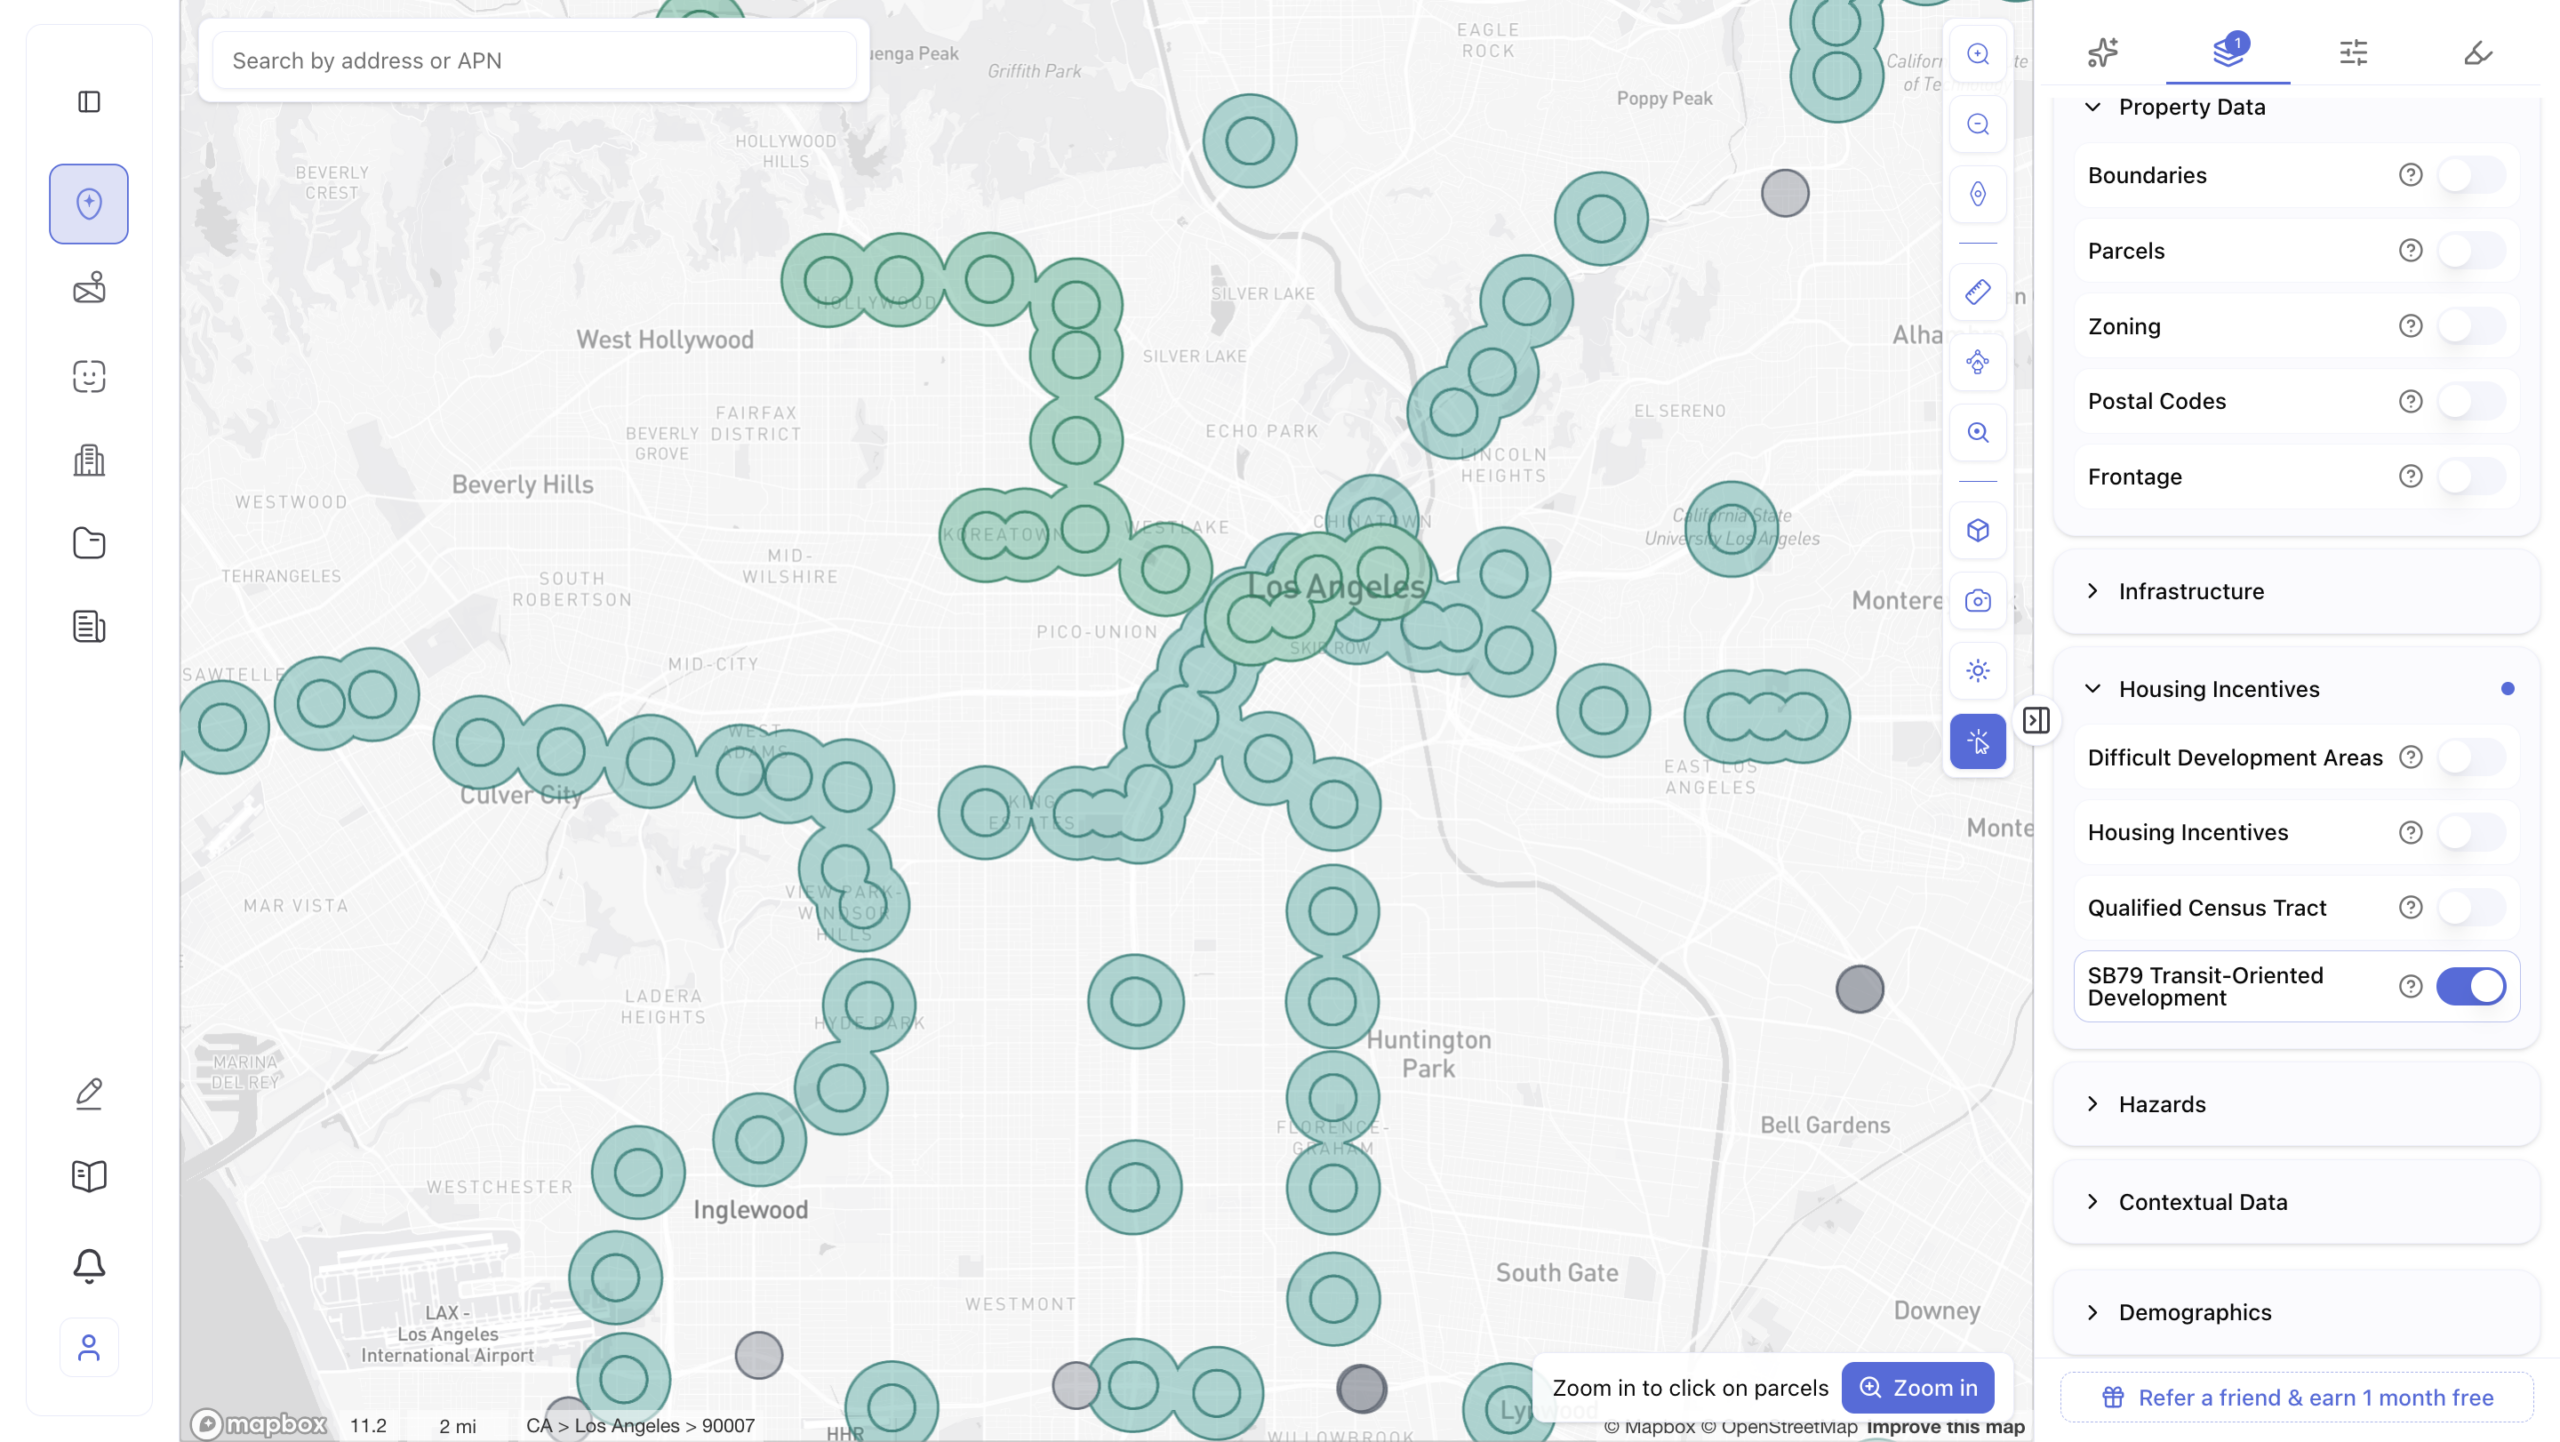
California’s SB-79, signed by Governor Newsom on October 10, 2025 and taking effect July 1, 2026, is one of the clearest examples of how state legislation can completely change what a site is legally allowed to support – regardless of what local zoning currently says.
The law applies only in specific California counties with significant transit infrastructure, including Los Angeles, Orange, San Diego, San Francisco, Alameda, San Mateo, Santa Clara, and Sacramento. Within these counties, local governments can no longer enforce zoning rules that fall below SB-79‘s state-mandated minimums near qualifying transit stops. State standards override local restrictions.
SB-79 sets minimum height and density floors based on distance from transit, organized into two tiers. Tier 1 covers heavy rail and very high-frequency commuter rail lines (BART, Caltrain, and major LA Metro rail). Tier 2 covers light rail, high-frequency commuter rail, and qualifying bus rapid transit.
The key figures from the statute itself:
- Within 200 feet of a Tier 1 stop: up to 9 stories
- Within ¼ mile of a Tier 1 stop: up to 7 stories
- Between ¼ and ½ mile of a Tier 1 stop: up to 6 stories
- Within 200 feet of a Tier 2 stop: up to 8 stories
- Within ¼ mile of a Tier 2 stop: up to 6 stories
- Between ¼ and ½ mile of a Tier 2 stop: up to 5 stories
For developers, this creates an immediate repricing opportunity. Parcels that didn’t pencil under old local zoning may now support real, viable projects. One estimate puts the potential new housing capacity in the City of LA alone at nearly 1.5 million homes – and many of those sites are not yet repriced.
All SB-79 projects must include affordable housing contributions. These typically include 7% extremely low income, 10% very low income, or 13% lower income units. The tradeoff is explicit: increased density in exchange for affordability participation.
Practical move: Model every transit-adjacent site twice – once under existing local zoning, once under SB-79 allowances. In many cases, that comparison alone determines whether a deal moves forward.
Pattern 3: FAR Bonuses and Overlay Incentives Most Teams Never Claim
FAR – Floor Area Ratio – is the ratio of a building’s total floor area to the size of the lot. A FAR of 2.0 on a 10,000 sq ft lot means you can build 20,000 sq ft total. Many jurisdictions offer bonus FAR that developers routinely leave unclaimed.
Including a public plaza, investing in transit infrastructure, or committing to affordable housing units can all unlock extra floor area above the base limit. Overlay districts – layers of zoning rules applied on top of base zoning – often carry their own density bonuses. A parcel with a three-story base zoning limit sitting in a Transit-Oriented Development overlay district might be permitted to go significantly taller in exchange for including a percentage of affordable units. That’s not a rezoning. That’s the code working exactly as intended.
The challenge is that these bonuses and overlays exist in separate PDFs, GIS systems, and municipal databases that are rarely integrated. They require active hunting – which is precisely what most teams skip under time pressure.
Pattern 4: Federal Incentive Designations That Reshape the Entire Capital Stack
This pattern doesn’t change what you can build. It changes whether the project pencils – and it’s the one most often missed entirely during site screening.
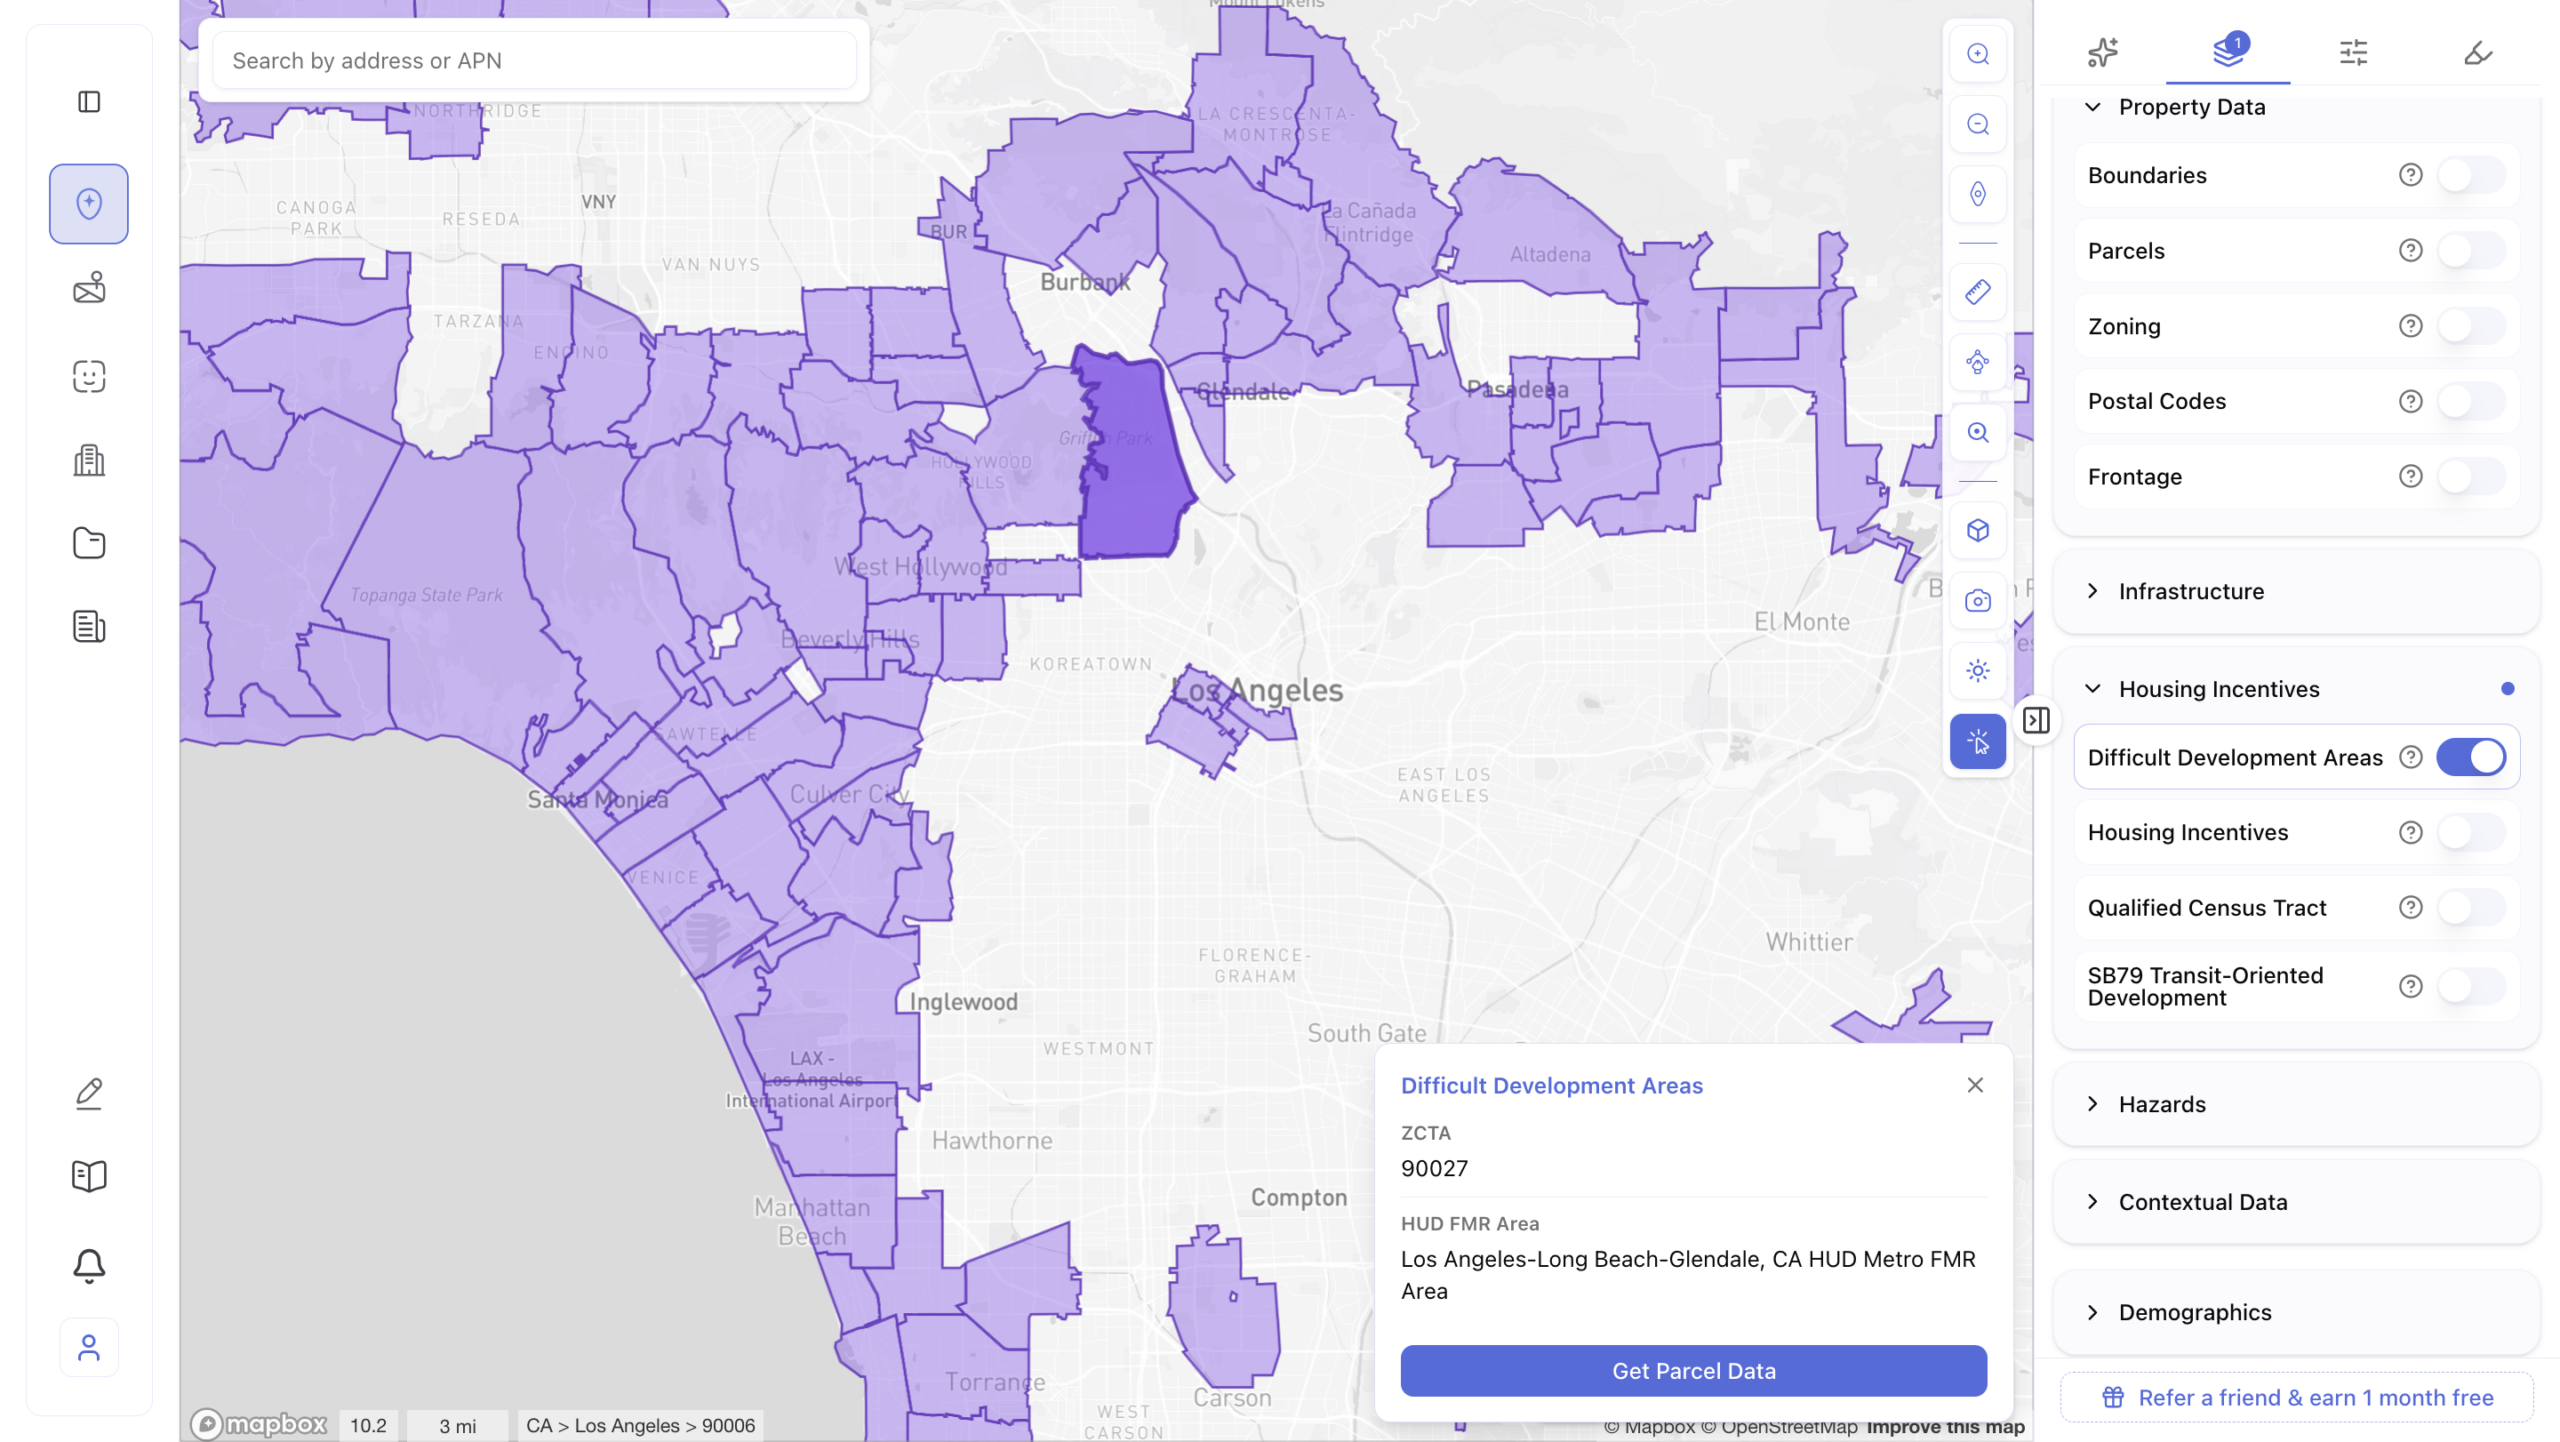
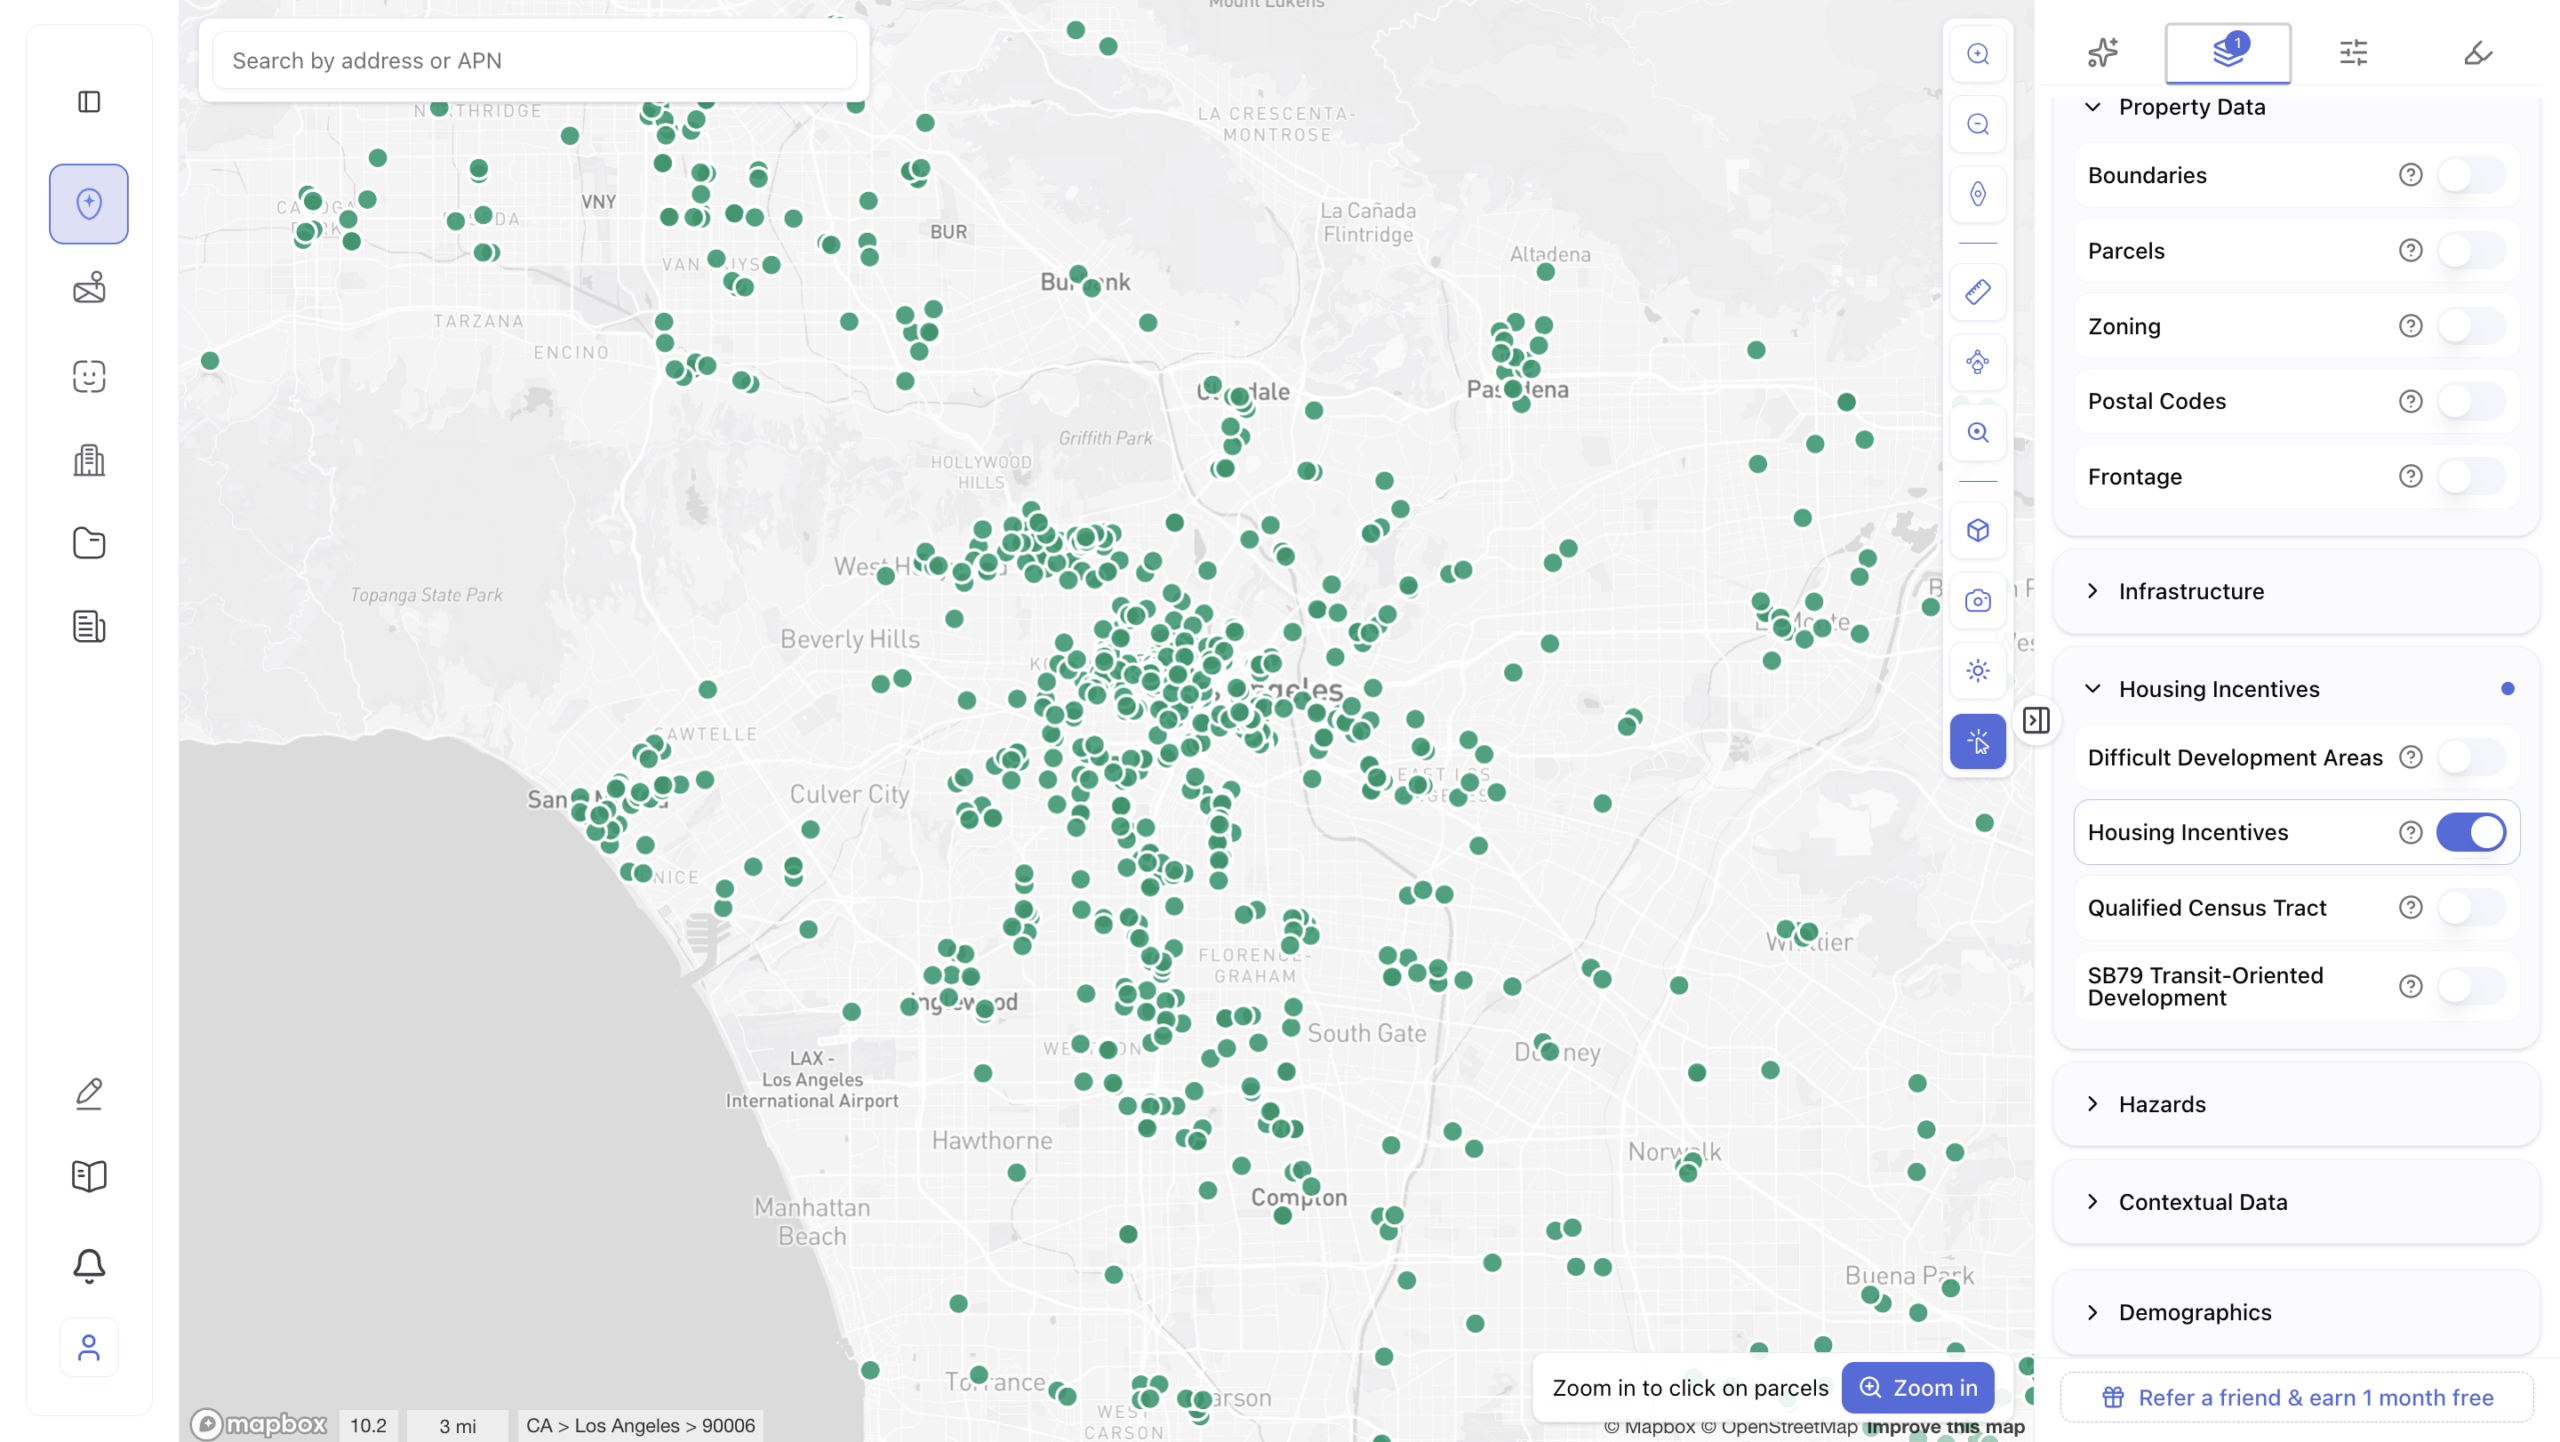
Difficult Development Areas (DDAs) and Qualified Census Tracts (QCTs) are federally designated geographies updated annually by HUD. Projects within these boundaries may qualify for a 30% basis boost under the Low-Income Housing Tax Credit (LIHTC) program – Section 42 of the Internal Revenue Code.
Here’s what that actually means. If a project has $10 million in eligible development costs (the eligible basis), a DDA or QCT designation increases that figure to $13 million for tax credit calculation purposes. That larger base generates more tax credits. More credits raise more investor equity. More equity reduces debt pressure and improves feasibility.
This is not a marginal improvement. It is a structural shift in the capital stack – one that can close a funding gap without redesign, additional subsidy, or deferred fees.
And most teams don’t verify it until underwriting is already underway. By then, the sequencing advantage is gone. In the worst cases, developers price land assuming a 30% basis boost that doesn’t exist. By the time the mistake surfaces, negotiating leverage has already shifted.
Critical detail: DDA and QCT boundaries follow census tract lines – not streets or neighborhoods. Two parcels on the same block can fall into different tracts, with one qualifying for significantly more equity than the other. These boundaries change every year. Early verification is essential, not optional.
Pattern 5: Upzoned Parcels Still Priced at Pre-Upzone Values
After a rezoning, it can take months – sometimes years – for land values to fully reflect the new development potential. Developers who identify these sites early can acquire based on current-use value and build based on new zoning rights.
Smart capital looks specifically for properties that are underutilized but fall within newly re-designated high-density zones – acquiring before the code is formally adopted and widely understood by the general market. You are buying based on current utility while planning for future entitlement potential.
There’s also a ripple effect. When one property is successfully rezoned, adjacent owners often follow suit. Identifying the early movers – before the cluster becomes obvious – is where the largest value capture happens. Once the market fully reprices, the window is closed.
Why Manual Research Misses These Patterns – Systematically
The five patterns above are all invisible without specific, multi-source data: state housing law databases, HUD designation lists that update annually, overlay maps held in separate municipal GIS systems, and local zoning code amendments layered across years of updates. No analyst can synthesize all of that efficiently across a pipeline of 20 or 50 sites.
A standard zoning report prepared by experienced professionals typically takes two to three weeks – and that assumes a cooperative, well-staffed municipal zoning department. Pre-development research as a whole can stretch from six months to two years. Meanwhile, an AI-equipped competitor is screening 200 sites in the time it takes a manual team to finish 10 – with all incentive and overlay layers already surfaced.
The problem isn’t skill. It’s scale. And AI zoning tools are what close it.
Industry voice: “If you’re depending on having boots on the ground to find deals, you will be left behind, because sophisticated funds will be algorithmically driven.” – Olivia Ramos, CEO, Deepblocks
How AI Zoning Analysis Tools Are Closing the Gap
AI-powered zoning platforms now automate what used to require weeks of multi-source research: base zoning lookup, overlay stacking, FAR and bonus calculations, state law eligibility mapping, federal incentive boundary verification, and hazard flag identification – all at once, for any parcel.
Cities are already proving the model. Honolulu cut permit wait times from months to days using AI pre-screening. Los Angeles deployed AI permit review tools (via Archistar) following the 2025 wildfires. Austin formally adopted the same technology in late 2024. Seattle is in full rollout in 2026. The efficiency gains are documented and real.
How ArchiWise AI Does This
ArchiWise was built specifically for the pre-acquisition stage – before design begins, before permits are filed, before capital is committed. Rather than requiring developers to cross-reference HUD PDFs, state housing law documents, and fragmented municipal GIS systems, ArchiWise integrates these layers into one parcel-level decision workflow.
The platform covers zoning rights (setbacks, height, FAR, permitted uses, overlay districts), SB-79 eligibility with Tier 1 and Tier 2 transit proximity mapping, Housing Incentives layers (DDA status, QCT boundaries, LIHTC eligibility), area intelligence from 50+ authoritative sources including USGS, FEMA, EPA, and CoStar, and real-time feasibility scenarios based on actual code – not assumptions.
Because listed properties represent less than 5% of viable development opportunities, ArchiWise screens all parcels in a market – listed or not – based on development criteria. The result is a ranked shortlist of viable sites with opportunity scores, including off-market parcels that no one else is looking at.
According to The AI Consulting Network, AI zoning tools can reduce the time to evaluate a property’s development potential from three to five business days to under four hours. For a team evaluating 20 sites, that’s the difference between a month of work and a single afternoon – with better coverage.
What This Means for Your Acquisition Strategy
The practical takeaway from all five patterns is the same: density capacity analysis – including incentive eligibility and state law overrides – needs to happen at Day 1, not Week 4.
Before committing serious research time to any site, three questions should be answered first:
- What does the base zoning actually allow? Not what the current use suggests – what the current code and any recent state-level overrides actually permit.
- Are there overlay districts, state laws, or bonus programs that change that baseline? SB-79 tier classifications, TOD overlays, affordable housing programs – any of these can expand the buildable envelope significantly.
- Are there federal incentive designations tied to this location? DDA or QCT status can change how much equity a project can raise – sometimes more materially than a zoning variance or design change.
Sites that answer ‘more than expected’ to any of these questions are where the real opportunities live. AI site screening tools make this a Day 1 filter – not a Week 4 discovery.
The Map Was Already There – Now You Can Read It
The developer who built 120 units didn’t have a magic advantage. They had better information, processed faster, at the right moment in the decision cycle.
The patterns above aren’t obscure loopholes. They’re embedded in publicly available zoning codes, state housing legislation, HUD designation databases, and municipal overlay maps. The information exists. The question is whether your team finds it before your competition does.
In 2026, state laws like SB-79 are actively reshaping what transit-adjacent land can legally support. Federal programs like DDA and QCT are changing what deals can financially support. And AI platforms are making all of it visible at the parcel level in minutes, not weeks.
The density is already there. The zoning already allows it. The incentives are already designated. The state law is already written.
What changes is whether you see it first.
Ready to see what your next target parcel actually allows? Explore ArchiWise AI’s zoning analysis, housing incentives, and SB-79 eligibility layers – and run your first site screen free at archiwise.ai.
Learn more
ArchiWise helps developers, investors, architects, and brokers go from address to decision in minutes, not weeks.
Whether you’re screening sites for multifamily development, evaluating zoning constraints, surfacing incentive eligibility like QCT and LIHTC, or assessing hazard risk before committing capital, ArchiWise runs every layer of analysis in one place.
Explore how ArchiWise helps teams screen development sites, analyze zoning, and make confident go/no-go decisions faster.