

How developers are using AI to find sites, read zoning, assess hazards, screen incentives, evaluate subdivision potential, and source deals off-market – before a dollar is committed.
Pre-development research has always been the part of real estate that kills momentum. Not because the questions are hard – because answering them takes too long.
What can I build here? Is this zone right? What are the hazards? Who owns the parcel next door? Does this site qualify for a density bonus? Can this lot be split? Every question points to a different database, a different agency portal, a different consultant. By the time you’ve stitched the answers together for one site, the opportunity may already be gone.
AI is changing that. Not by replacing the developer’s judgment – but by closing the gap between having a question and having the information needed to answer it. Here are six specific situations where AI is making the biggest difference, and exactly what ait does in each one.
Use Case 1: Site Selection and Screening
Most developers evaluate sites the same way: one at a time, manually, starting from an address someone else gave them. A broker calls. A listing appears. The developer researches. Most of the time, the site doesn’t work – and the hours spent finding that out are gone.
AI flips that process entirely. Instead of starting from an address, you start from criteria.
The old way: Compile a list of addresses from brokers, listings, or local knowledge. Research each one individually. Finding off-market opportunities means canvassing, relationships, or luck.
With AI: Set your buy box – lot size, year built, current use, vacancy status, ownership type, zoning, land value range, demographics – and the platform instantly highlights every parcel in your target area that fits. No address required.
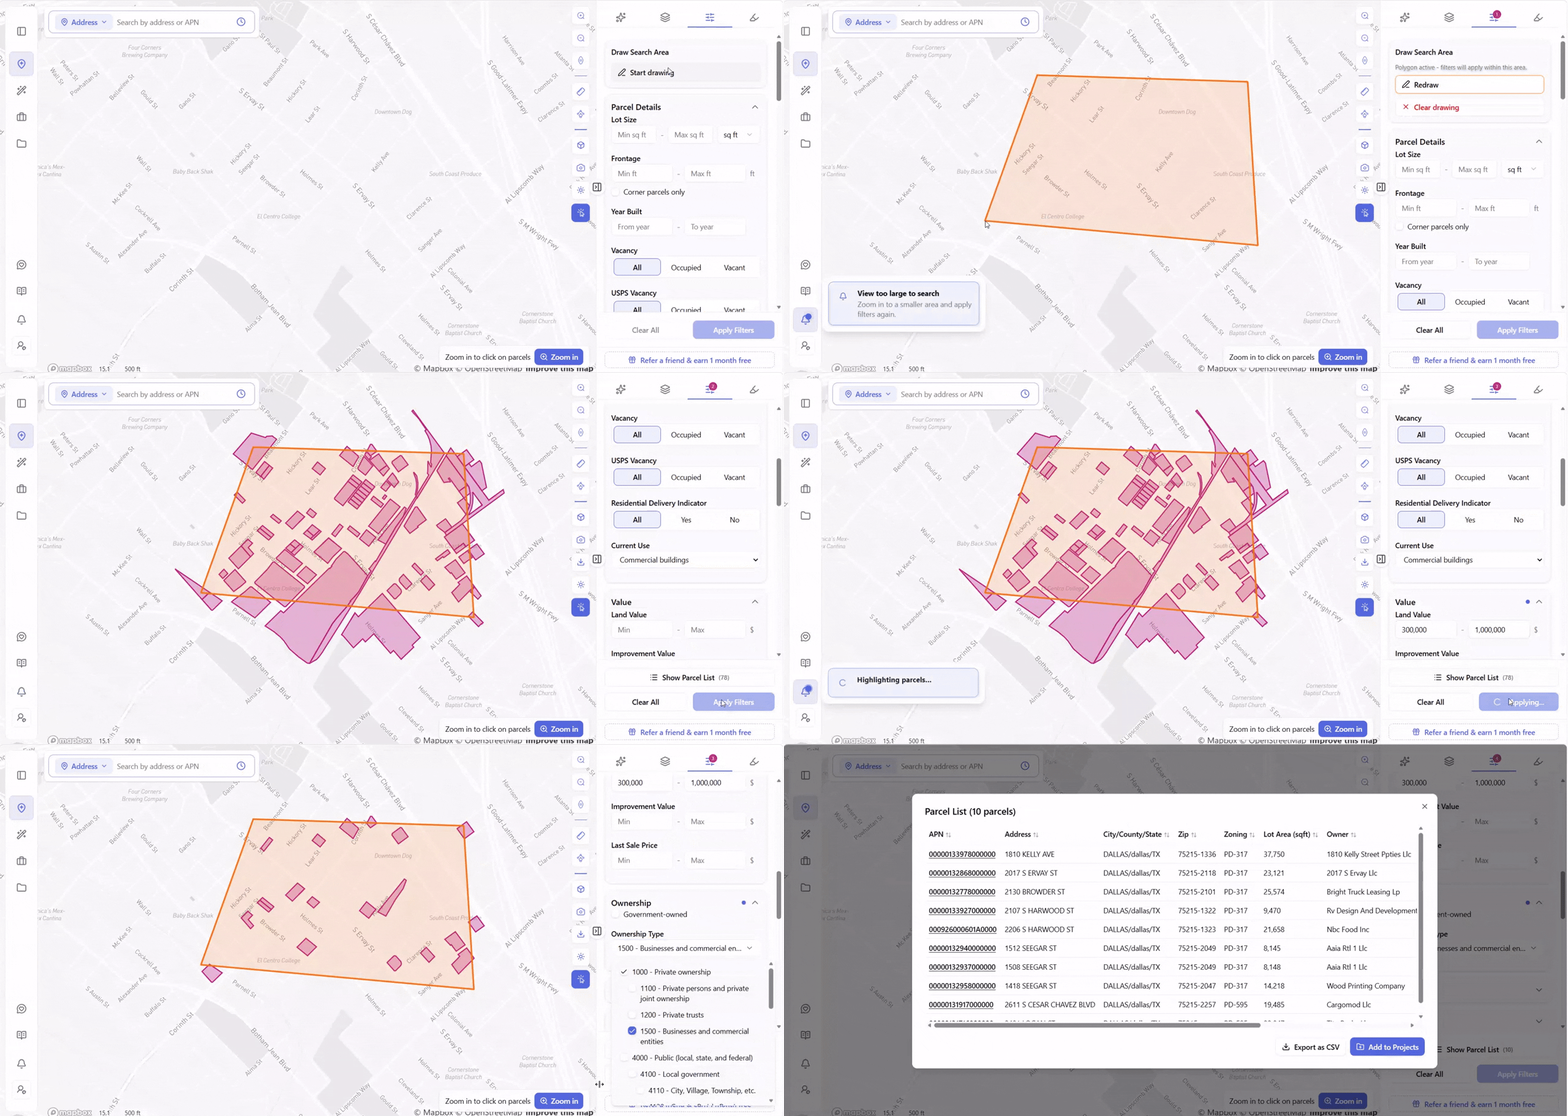
In Archiwise, the workflow starts with the Draw Search Area tool – draw a polygon directly on the map to define your target area. Then open the filter panel and stack your criteria. For example:
- Current Use: Commercial
- Ownership Type: 1500 – Businesses and commercial entities
- Value: $300,000 – $1,000,000
Hit Apply Filters and watch the match count shift with each criterion: Current Use: Commercial narrows the drawn area first, Value: $300,000–$1,000,000 narrows it further, and Ownership Type: 1500 – Businesses and commercial entities brings the final count down to ten matching parcels.
Open the Parcel List and all ten appear in a structured table – APN, address, city, zip, zoning, lot area, and owner name – all in one view, ready to export as a CSV or add directly to a Project. Ten real candidates, sourced without a single call, before anyone even picks up the phone. (From here, clicking into any one of them opens the full info modal – zoning, ownership, value, hazards, incentives, demographics – in the same click.)
“A commercially zoned parcel, business-owned, assessed between $300K and $1M – that’s exactly the kind of redevelopment candidate most developers spend days hunting manually. Archiwise surfaces it in seconds.”
Time saved: Site prospecting that previously took days of manual county record searches now takes minutes. The address-first constraint – which previously defined the entire site sourcing process – is gone.
Use Case 2: Zoning Analysis and Code Interpretation
Zoning is where the most expensive mistakes in real estate happen – and where AI delivers some of its most immediate value.
Every parcel sits in a zone with its own rules: permitted uses, prohibited uses, FAR limits, height limits, setbacks, parking requirements, overlay conditions. Reading and interpreting those rules for a single site takes hours. For ten candidate sites, it takes days. For a site with stacked conditions – a [Q] condition, a specific plan, and a density bonus – it can take a full day of code reading just to understand what’s actually allowed.
The old way: Identify the zoning designation, find the applicable code section, cross-reference height districts, overlay conditions, and any [Q] restrictions, calculate density manually, then call the planning department to confirm.
With AI: Click the parcel. The Zoning tab immediately surfaces permitted uses, conditional uses, prohibited uses, FAR, height limits, setbacks, lot coverage, density, and parking requirements – with a direct link to the applicable code. For deeper questions, the AI Zoning Expert answers in plain language, with every figure cited to the exact code section it came from.
The AI Zoning Expert in Archiwise is a chat interface grounded in a dedicated knowledge base of official planning documents – zoning codes, general plans, specific plans, community plans, overlay ordinances, and state legislation – for every city, county, and state in the US. Ask it anything about the parcel in front of you and it answers for that specific parcel, in that specific jurisdiction, with the source cited.
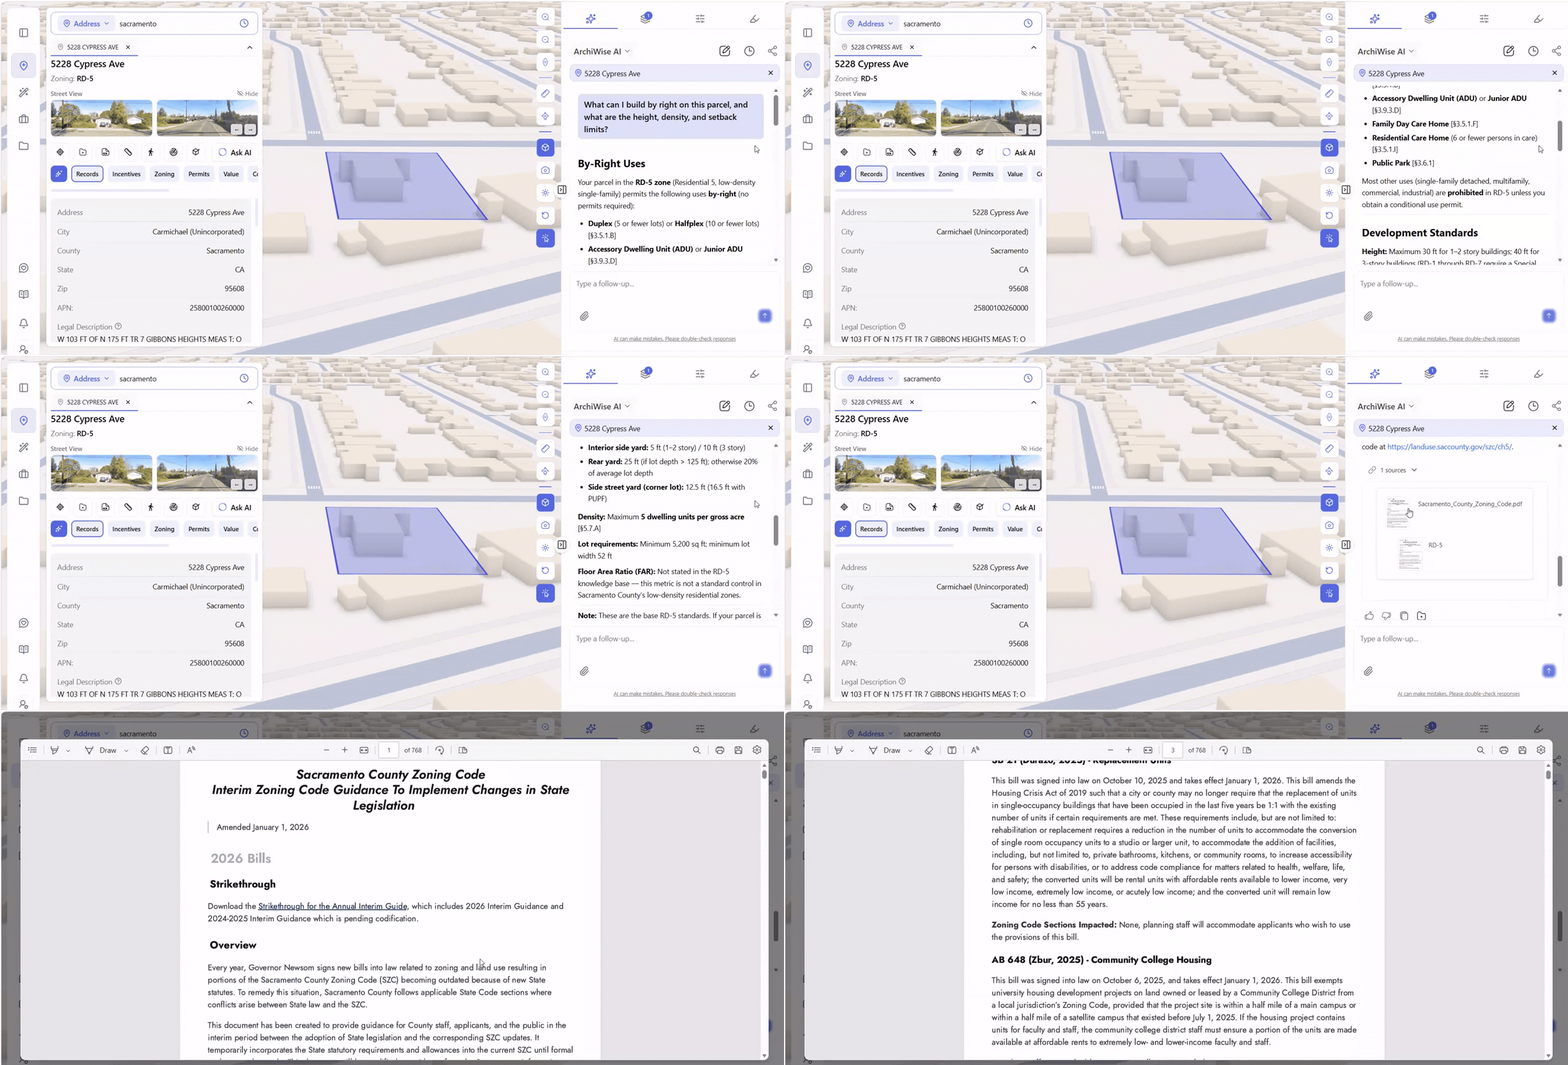
Real example: A developer evaluating 5228 Cypress Ave in Carmichael, an unincorporated part of Sacramento County, California, asks the AI Zoning Expert: “What can I build by right on this parcel, and what are the height, density, and setback limits?” Because Carmichael is unincorporated, the parcel isn’t governed by a city zoning code at all – it falls under Sacramento County’s zoning code instead, and the AI correctly identifies that distinction: its answer is cited to the Sacramento County Zoning Code, not a city ordinance or a generic guess based on the surrounding area. The parcel sits in the RD-5 zone – Residential 5, low-density single-family – and the by-right list alone runs five uses deep, no permit required for any of them: a duplex on lots of 5 or fewer, or a halfplex on lots of 10 or fewer [§3.5.1.B]; an accessory dwelling unit or junior ADU [§3.9.3.D]; a family day care home [§3.5.1.F]; a residential care home for six or fewer persons [§3.5.1.I]; and a public park [§3.6.1].
The rest of the answer holds the same level of specificity: density capped at 5 dwelling units per gross acre [§5.7.A], a minimum lot size of 5,200 sq ft with a 52 ft minimum width, and setbacks that change depending on which wall and how many stories: 20 ft in front (24 ft if a PUPF easement applies), 5 ft on interior side yards for one or two stories but 10 ft for a third story, 25 ft in back on deeper lots, and 12.5 ft on the street side of a corner lot. A third story specifically triggers its own Development Permit requirement [§5.4.2] – a conditional trigger a plain zoning summary would never surface, let alone cite.
Time saved: Zoning research that previously required hours or even days of manual work across multiple code documents now takes under 5 minutes.
Use Case 3: Hazard and Risk Assessment
A site that looks viable on paper can turn out to be in a flood zone, on top of a fault line, inside a fire hazard severity zone, or in a methane area that requires special construction. Most developers don’t find out about hazard exposure until they’re under contract and paying for environmental studies. By then, earnest money is on the line.
The old way: Check FEMA for flood zone. Check a state or local fire agency for wildfire hazard. Check USGS for seismic data. Check local agencies for methane. Each a different portal, a different interface, a different data format – with no way to see how hazards intersect on a single parcel.
With AI: Click the parcel. The Hazards tab surfaces seismic rating, fault proximity, flood zone designation, fire hazard severity, methane risk, and fire footprints simultaneously – all in one view, before any commitment is made.
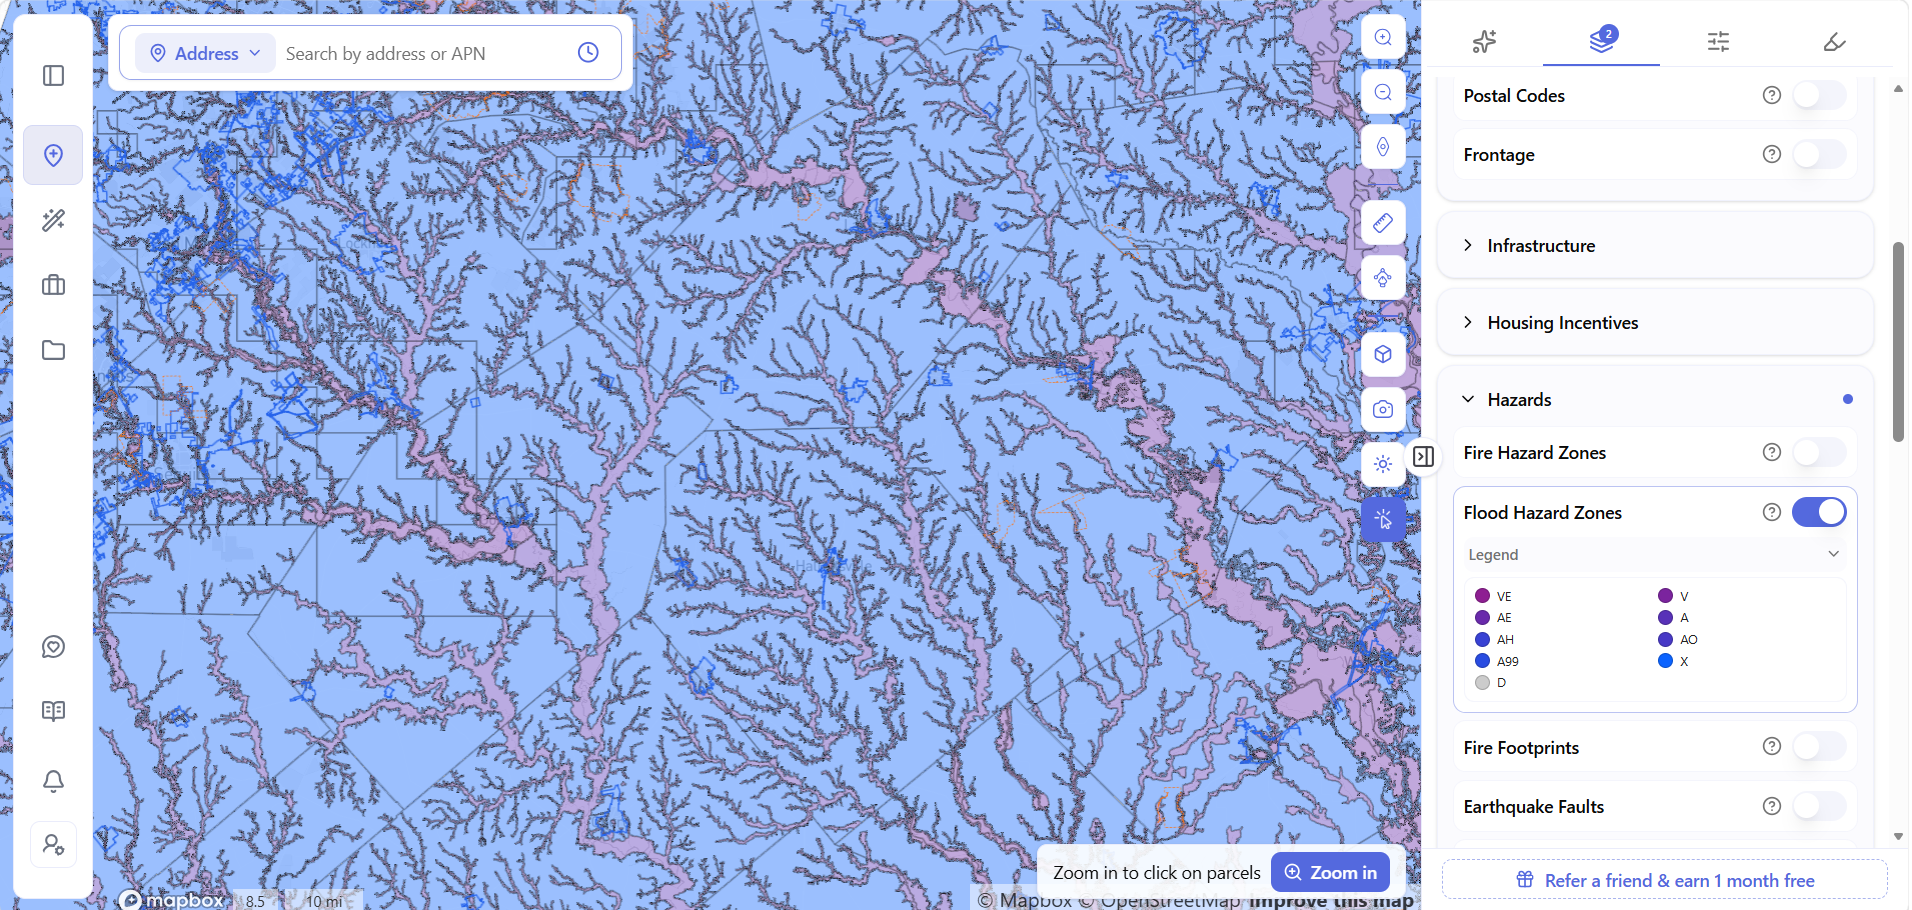
Archiwise’s Hazards tab pulls from FEMA, USGS, and state/local fire and environmental databases simultaneously. Map layers for Fire Hazard Zones, Flood Hazard Zones, Earthquake Faults, Seismic Hazard, Fire Footprints, and Methane Hazard Areas can be toggled on to see how risks distribute across an entire corridor – not just the parcel you clicked, but everything around it.
The platform also surfaces infrastructure risk through a separate layer group: Gas Pipelines (with PHMSA/PIPA consultation zones), Electricity Lines (color-coded by voltage), and Sewer Lines – toggled on the same map. A pipeline crossing a site shows up at the screening stage instead of three months into due diligence.
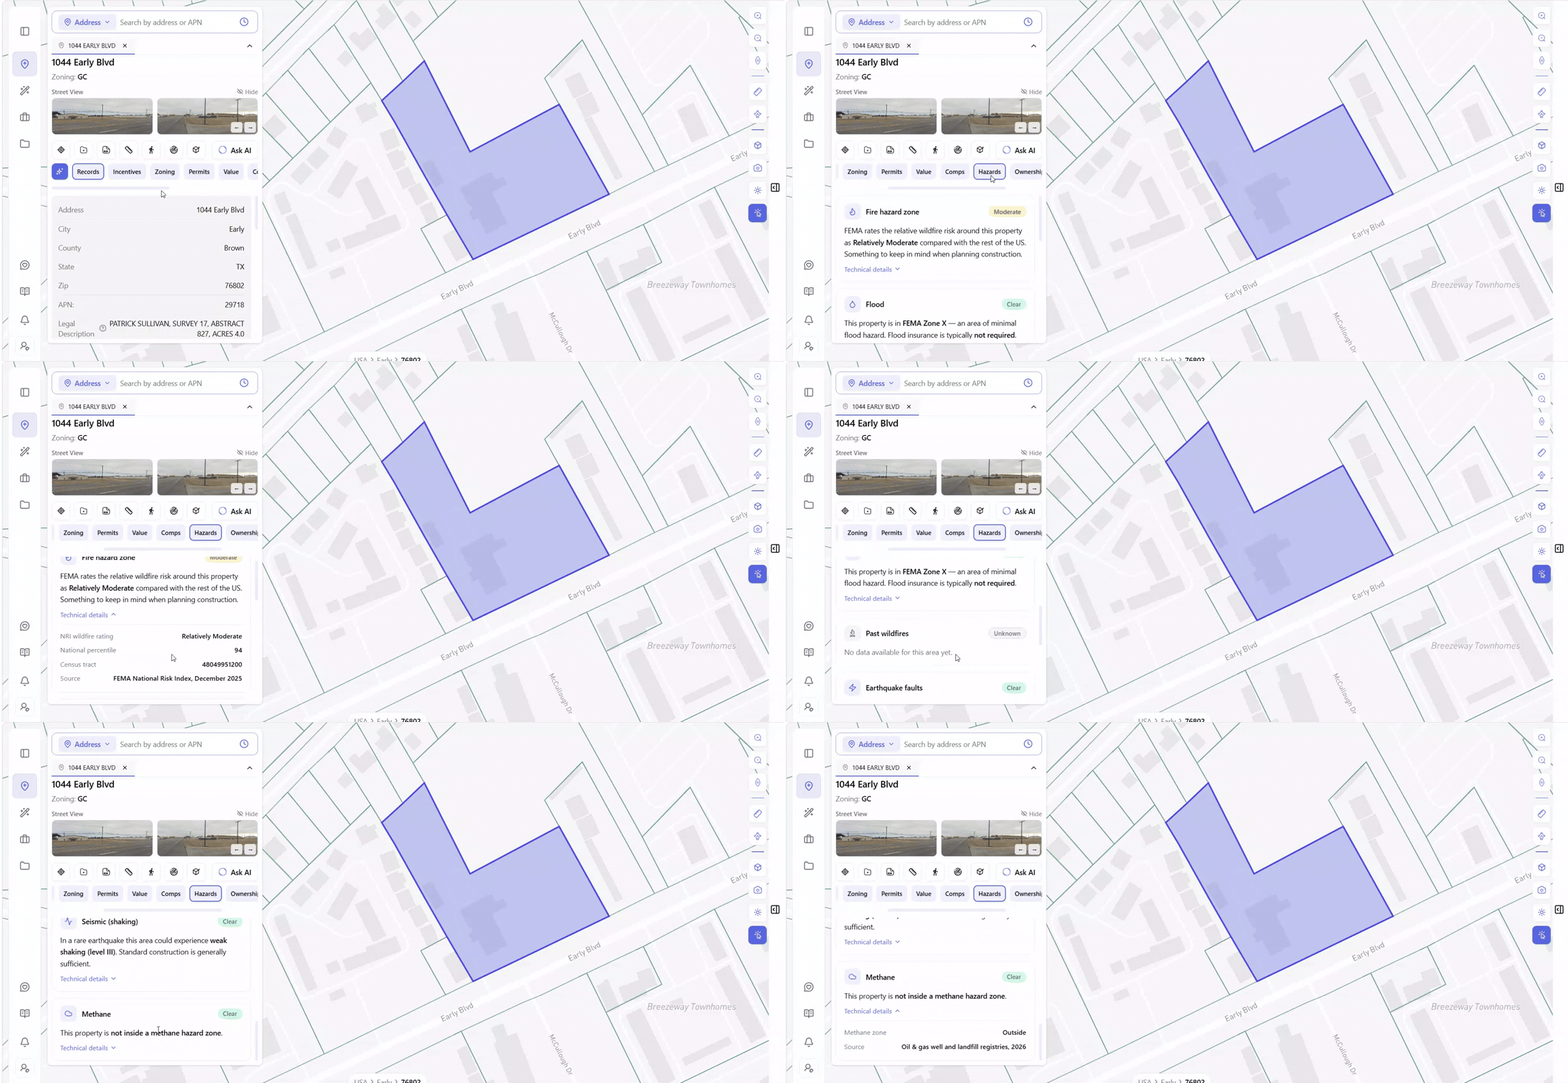
Real example: 1044 Early Blvd, zoned GC in Early, Texas, is a useful example precisely because most of its hazard picture is clean. The Hazards tab shows: Flood – Clear, in FEMA Zone X, an area of minimal flood hazard where flood insurance typically isn’t required; Earthquake faults – Clear, no known fault trace runs through or near the parcel; Seismic (shaking) – Clear, a rare earthquake would produce only weak shaking (Level III), and standard construction is generally sufficient; and Methane – Clear, the parcel isn’t inside a methane hazard zone.
The one flag: Fire hazard zone rated Moderate, with a wildfire risk in the 94th percentile nationally – high enough to be worth factoring into construction planning even though the platform’s own label reads “Relatively Moderate.” Every rating traces back to a named source and date: FEMA National Risk Index, December 2025.
There are two ways to see this. Click the parcel directly and the Hazards tab lays out each risk with a plain-language explanation, a Clear or Moderate flag, and a Technical details toggle for the underlying rating, percentile, and source. Or turn on the same hazard layers – Fire Hazard Zones, Flood Hazard Zones, Earthquake Faults, Seismic Hazard, Methane Hazard Areas – as map overlays and see how risk distributes across an entire corridor or region before narrowing down to one address.
 Time saved: Hazard research that previously required separate searches across FEMA, USGS, and state or local databases now takes under 5 minutes – before any professional fees begin.
Use Case 4: Incentive and Subsidy Eligibility Screening
The difference between an affordable housing project that pencils and one that doesn’t often comes down to a single question: does this site qualify for incentive programs?
A Qualified Census Tract designation unlocks a 30% boost on Low Income Housing Tax Credits. A TOC Tier 4 designation eliminates parking requirements and allows up to 80% density increase. A nearby LIHTC precedent confirms the financing pathway has been successfully navigated in the same neighborhood. Missing any of these is leaving documented money on the table.
The old way: Check TOC tier eligibility on one map. Check QCT status on a separate federal database. Check DDA designation on another. Check SB 9, SB 35, SB 79, AB 2011 eligibility across separate state program pages. Each check is manual, each uses different criteria, and the programs don’t talk to each other.
With AI: Click the parcel. The Incentives tab screens automatically against every applicable program simultaneously – and surfaces the results the moment the parcel is opened.
Archiwise’s Incentives tab screens every parcel against TOC tier, QCT status, DDA designation, SB 9, SB 35, SB 79, AB 2011 eligibility, and nearby LIHTC precedents – all in one click. The AI Zoning Expert can then answer how stacking multiple incentives affects the total unit count for that specific site.
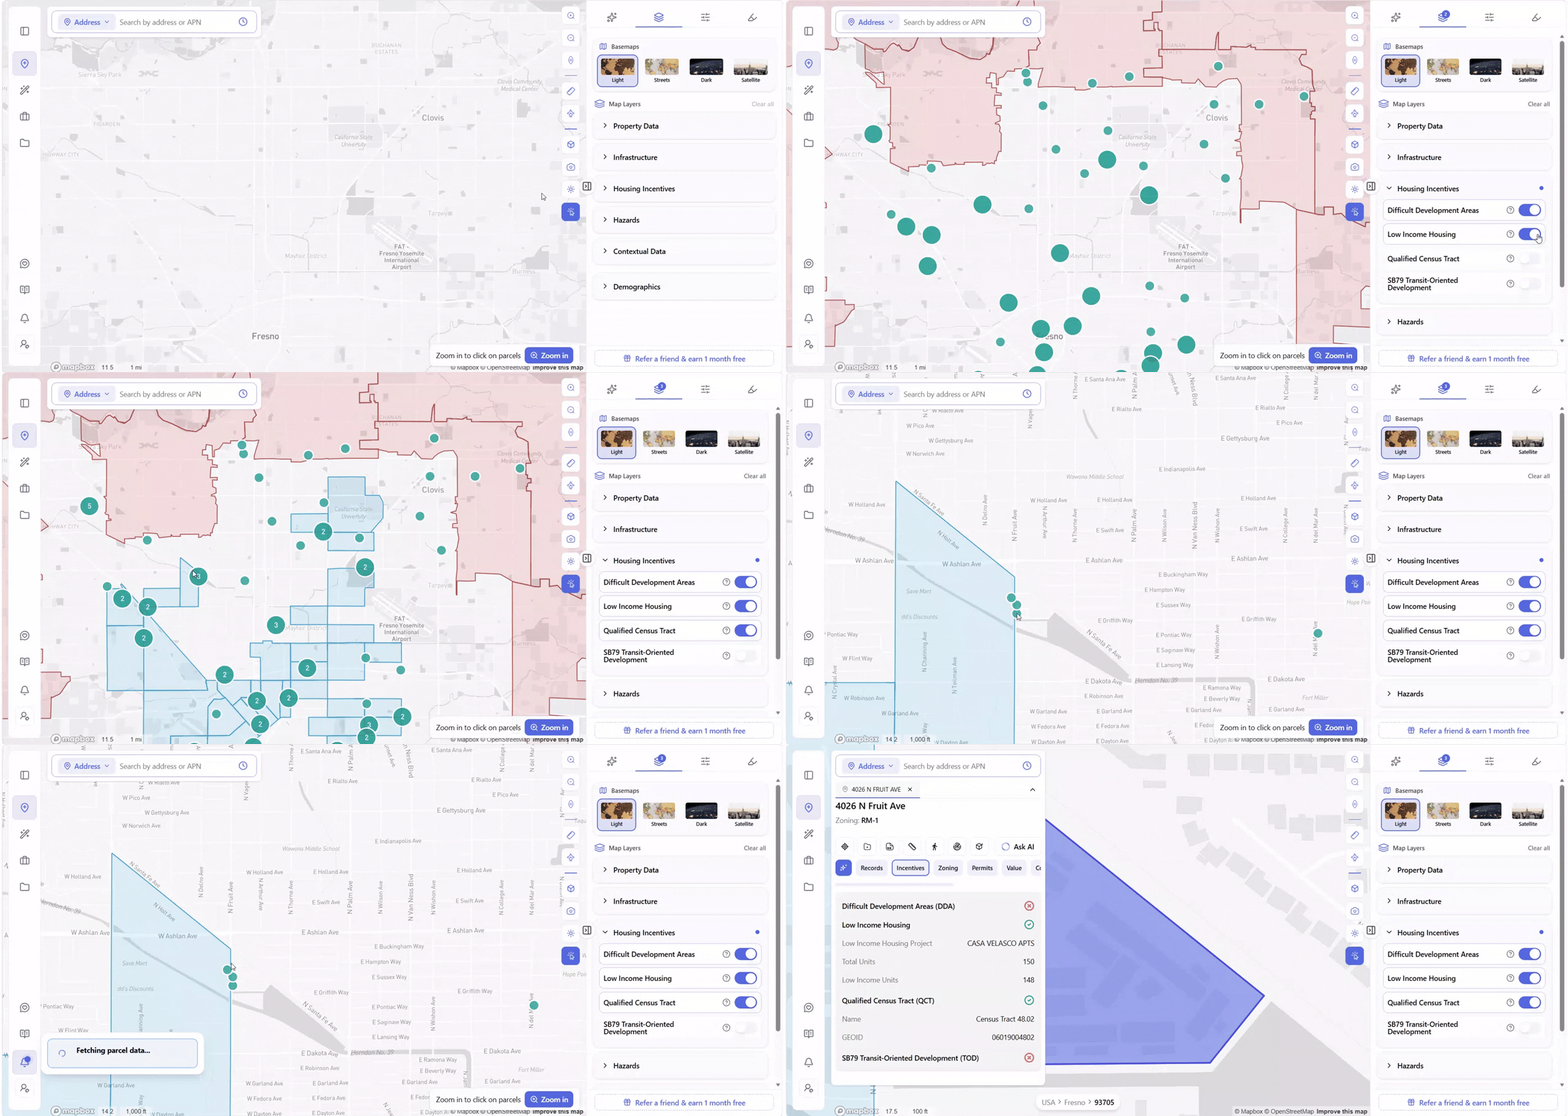
Real example: A developer scanning the Fresno–Clovis area turns on the Housing Incentives map layer – Difficult Development Areas, Low Income Housing, and Qualified Census Tract toggled on together – and the map clusters every matching project into number markers across the region, from single projects up to clusters of five or more.
Clicking one of those markers near W Ashlan Ave surfaces a project popup directly on the map: CASA VELASCO APTS, 150 total units, 148 of them low income – with a Get Parcel Data button one click from the full picture.
That click opens 4026 N Fruit Ave (zoned RM-1): Difficult Development Areas – not eligible; Low Income Housing – eligible, tied to that same CASA VELASCO APTS project; Qualified Census Tract – eligible, Census Tract 48.02, GEOID 06019004802; SB79 Transit-Oriented Development – not eligible. Four different eligibility answers on one parcel, each with its own designation, surfaced in the same click that opened it.
Time saved: Incentive screening that previously required separate QCT map lookups, LIHTC database searches, and TOC tier verification – done in one click.
Use Case 5: Subdivision & Parcel Assemblage
Land subdivision – the legal process of dividing one parcel into two or more separate lots – is one of the most opportunity-rich and least-analyzed areas in real estate. A large underutilized parcel that can be legally split into two buildable lots is worth significantly more than its current assessed value suggests. But evaluating whether a split is even legally possible has historically required a planning consultant and days of research.
AI makes this a two-minute go/no-go decision instead of a two-day research project.
The old way: Look up the zone’s minimum lot area. Find the minimum lot width requirement. Check frontage requirements. Cross-reference the general plan. Confirm consistency. Calculate whether the parcel dimensions actually support a legal split. Call a surveyor or planning consultant to verify.
With AI: Ask the AI Zoning Expert. It checks minimum lot standards against actual parcel dimensions, confirms whether a legal split is feasible, explains what each resulting lot could support, and cites the specific code section governing each requirement.
For single-family zones, SB 9 adds another dimension entirely. California’s SB 9 allows by-right lot splits on single-family zoned parcels – bypassing the standard subdivision process – in qualifying locations. Archiwise’s AI Zoning Expert is grounded in state legislation including SB 9, meaning it can confirm SB 9 eligibility for a specific parcel, explain what the resulting lots could support, and flag any local conditions that might affect eligibility – all cited to the actual bill text.
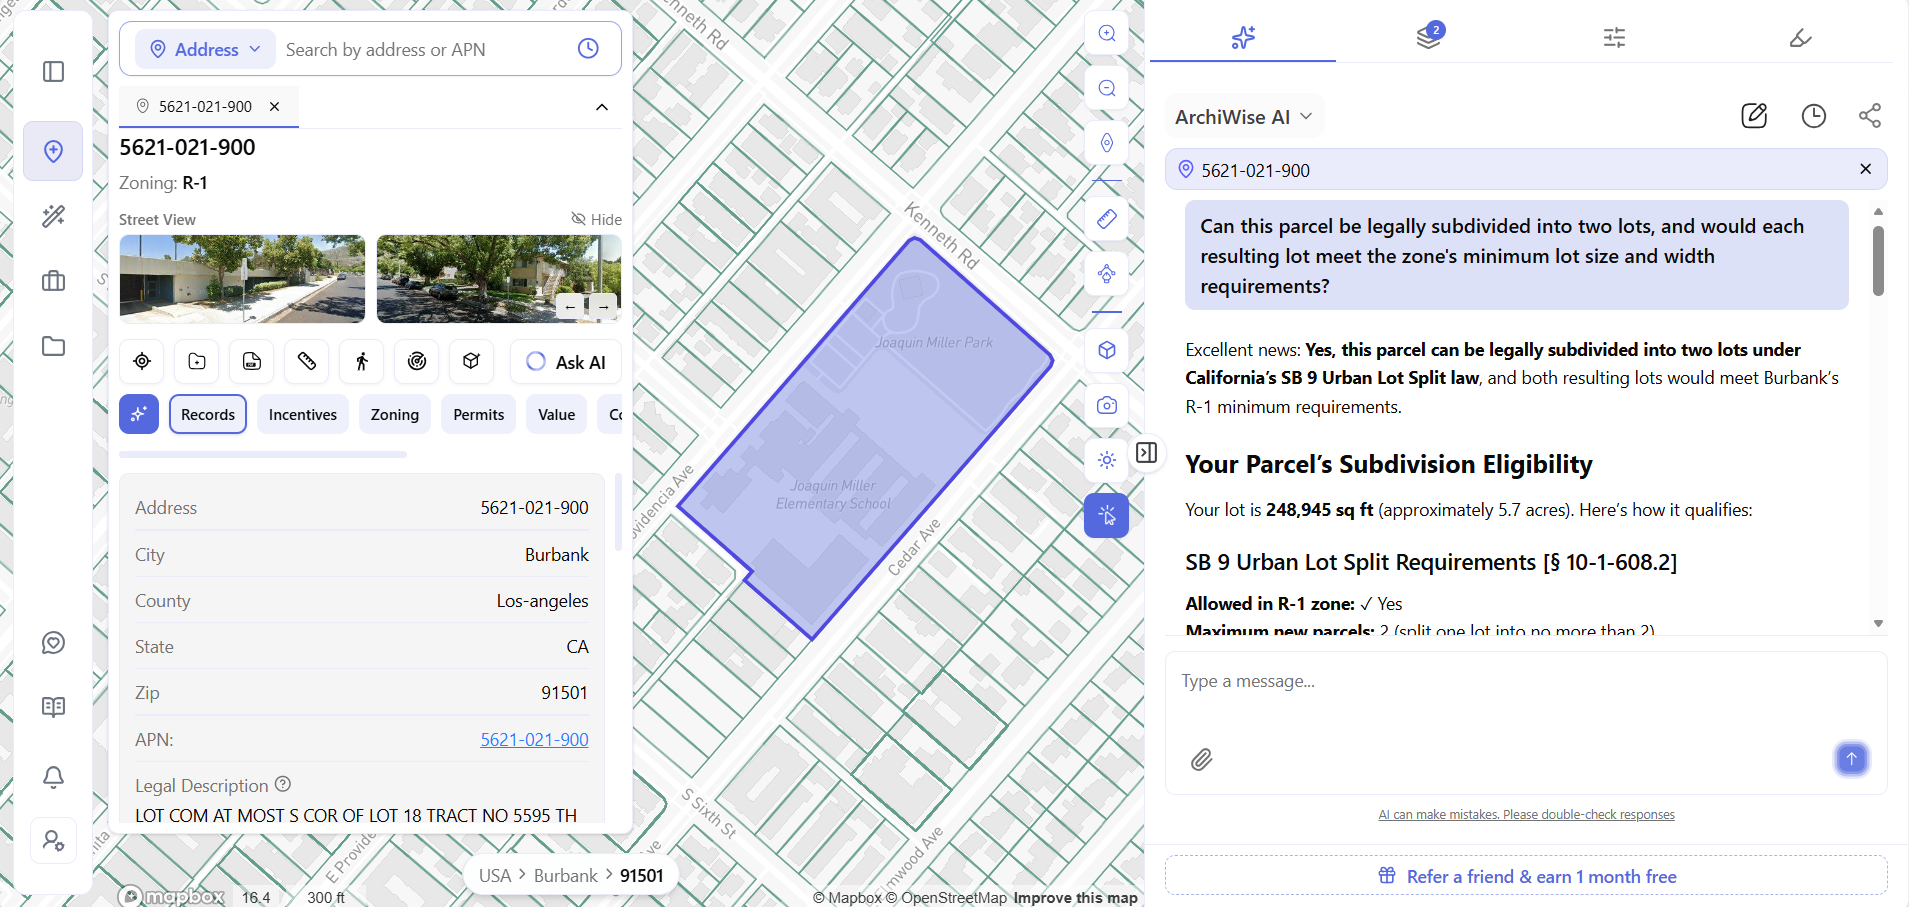
Real example: A parcel identified by APN 5621-021-900 in Burbank, California (zoned R-1) asks exactly this question. At 248,945 sq ft – roughly 5.7 acres, unusually large for a single-family lot, it’s a strong subdivision candidate on size alone. The AI doesn’t just confirm a generic subdivision: it identifies that the parcel qualifies under California’s SB 9 Urban Lot Split law [§ 10-1-608.2] – the correct state-law mechanism, not a generic local subdivision answer – confirms the split is allowed in the R-1 zone, and caps the result at 2 new parcels.
For multi-parcel assembly, the same workflow applies in reverse. Select up to five adjacent parcels in Archiwise and the Combined panel instantly shows total lot area, total parcel value, and land vs. improvement breakdown for the full assemblage. The AI Zoning Expert answers what the combined site could support, whether merger is permitted under the applicable code, and what constraints could affect the project.
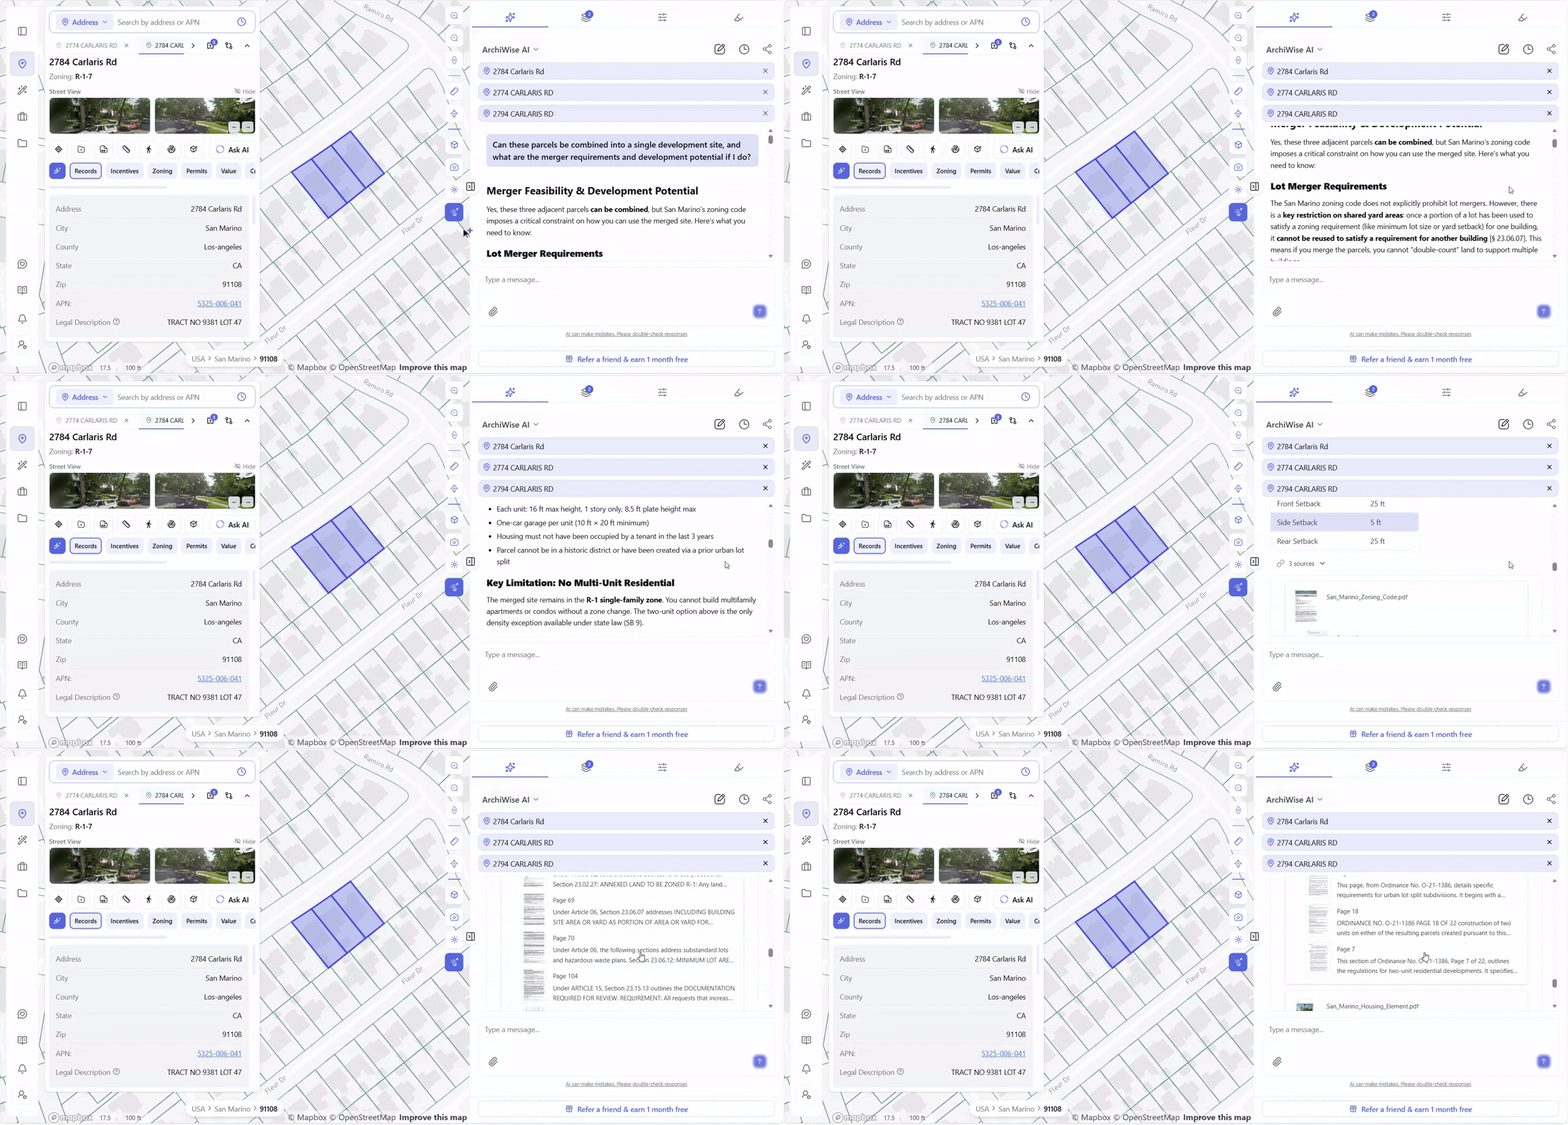
Real example: Three adjacent parcels on Carlaris Rd in San Marino, California – 2774, 2784, and 2794 Carlaris Rd, all zoned R-1-7 – are asked whether they can be combined into one development site. The AI confirms they can, but flags a real constraint most manual research would miss: San Marino’s code doesn’t prohibit lot mergers outright, but once part of a lot has been used to satisfy a zoning requirement for one building, it can’t be reused to satisfy a requirement for another [§ 23.06.07] – no double-counting land across multiple buildings on the merged site. Combined lot size: 21,398 sq ft (7,120 + 7,365 + 6,913 sq ft), zoned as Area District VII under San Marino’s R-1 standards [§ 23.02.09].
Every figure traces back to a named source document with a page number, not a generic answer: San Marino’s Zoning Code, its SB 9 & SB 35 Ordinance, and its Housing Element – three actual planning documents, cited by name and page.
Time saved: A subdivision feasibility question that previously required a planning consultant is answered in under 2 minutes – before any professional fees are incurred.
Use Case 6: Ownership Research and Off-Market Outreach
Every off-market deal starts the same way: you find a property worth pursuing, and then you need to find the person who can actually sell it to you. That second part – turning a promising parcel into a name and a mailing address – is where most outreach campaigns stall.
The information is public. The problem is what it takes to get it into a usable form. County assessor portals vary by jurisdiction, often show a name but not a mailing address, and only accept one APN at a time. At any real volume, the research becomes the bottleneck.
The old way: Access the county assessor portal for each parcel. Search by APN. Find the owner name – if the portal shows it. Find the mailing address – if the portal shows that too. Repeat for every parcel. Pay for a data pull or title company query when the portal doesn’t have what you need.
With AI: Click the parcel. The Ownership tab shows owner name, ownership type, mailing address, hold period, and Sell Candidate rating instantly – for any parcel in the US. Click Load Owner Contacts for phone numbers and email addresses where available.
Every parcel in Archiwise pairs a hold period – how long the current owner has held the property – with a Sell Candidate rating that scales with it, from Weak up to Very Strong. A property held for decades usually lands at the strong end of that range; one that changed hands recently usually doesn’t.
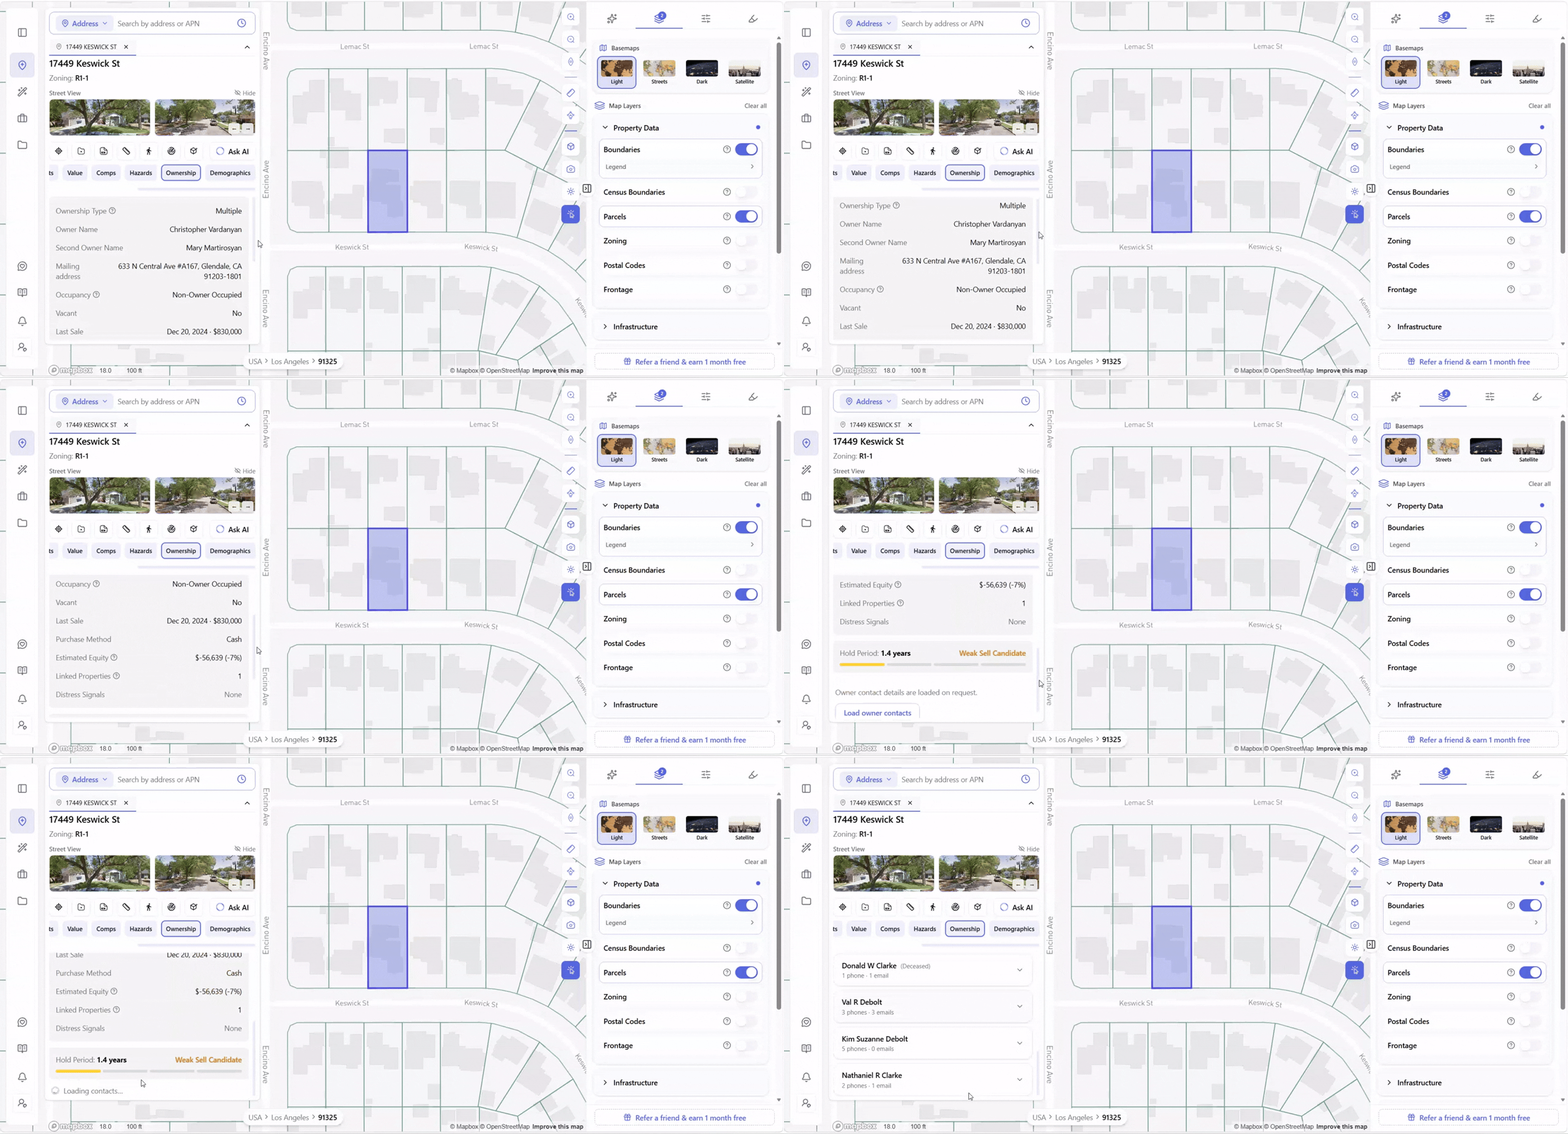
Real example: 17449 Keswick St in Northridge, CA (zoned R1-1) is owned by a private trust under Martirosyan Mary and Vardanyan Christopher, with a hold period of just 1.4 years – Archiwise flags it Weak Sell Candidate the moment the Ownership tab opens, no separate analysis needed to see this isn’t a long-held property.
Contact information sits one step further in: press Load Owner Contacts and the platform surfaces whatever phone numbers and emails exist for the people behind that trust – replacing what used to require hiring a skip-tracer, paying them per lookup, and hoping the results they sent back hadn’t already gone stale.
For sourcing at scale, the Ownership filter applies the same logic across an entire area. Filter directly by Government-owned parcels, or open the Ownership Type field and choose from the full checklist of numbered codes – private persons, private trusts, businesses and commercial entities, nonprofit ownership by subtype, and more. The map updates instantly to show only the parcels that match.
The Radius Map tool adds a third dimension: generate the complete ownership table for every parcel within a set distance – built for CUP/variance hearing notification requirements, but reads exactly like an instant prospecting list for every owner around a site worth watching.
Time saved: Ownership research that previously required separate county portal searches, paid data pulls, and title company queries – available instantly for any parcel in the US, at any scale.
The Common Thread
Every one of these six use cases shares the same structure: data that exists, scattered across multiple systems, requiring manual effort to assemble, arriving too late to influence the earliest and most consequential decisions in a deal.
AI doesn’t replace the developer’s judgment. It removes the research burden that precedes it – so that by the time a developer makes a call on a site, they’ve already seen the zoning, the hazards, the incentives, the subdivision potential, and the ownership picture, without spending a week in county portals to get there.
The developers who use AI most effectively are not the ones who outsource their thinking to it. They’re the ones who use it to think faster, with better information, earlier in the process.
Every use case in this article is live in Archiwise today – for any parcel in the US, in seconds.
See every use case in action.
Learn more
ArchiWise helps developers, investors, architects, and brokers go from address to decision in minutes, not weeks.
Whether you’re screening sites for multifamily development, evaluating zoning constraints, surfacing incentive eligibility like QCT and LIHTC, or assessing hazard risk before committing capital, ArchiWise runs every layer of analysis in one place.
Explore how ArchiWise helps teams screen development sites, analyze zoning, and make confident go/no-go decisions faster.