
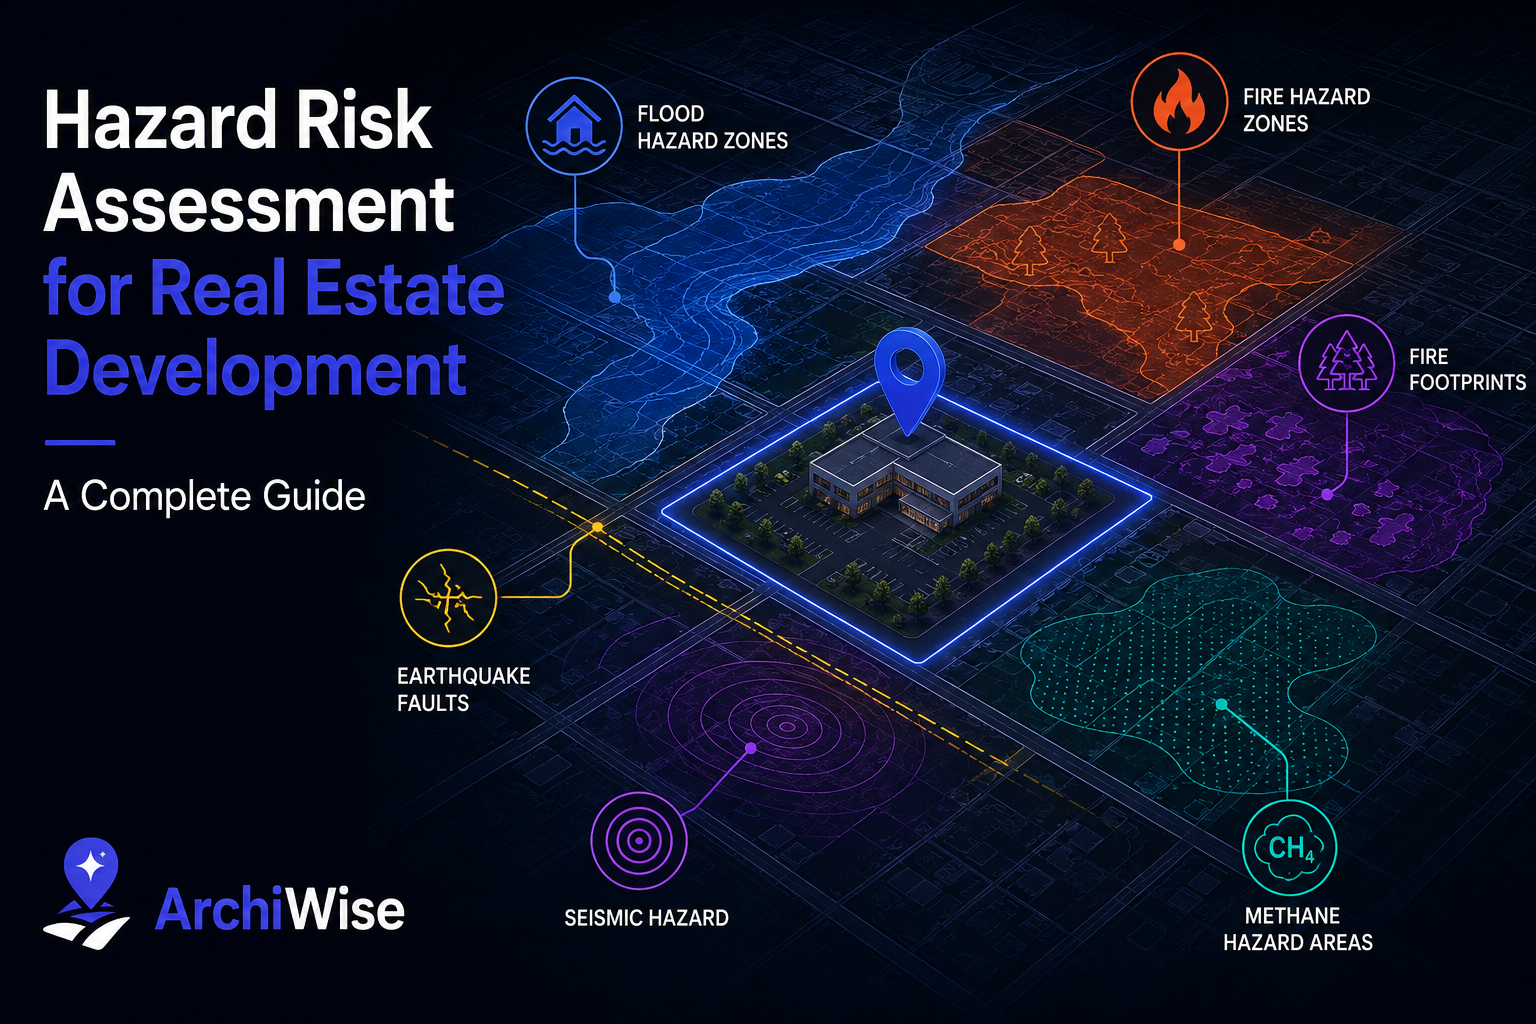

One fault line, one flood zone, one methane pocket under the wrong parcel – and a deal that looked clean on paper turns into a lender condition, an insurance denial, or a six-figure change order mid-construction.
Most developers don’t find that out early. They find it out during a Phase I environmental report, or a geotechnical study, or a call from an insurance underwriter – months after the purchase agreement is signed and real money is already committed.
Hazard risk assessment exists to move that discovery to the front of the process instead of the back. Here’s what it actually involves, why it gets skipped, and how to run one properly before you make an offer.
What Is Hazard Risk Assessment?
Hazard risk assessment is the process of identifying and quantifying the natural and environmental risks tied to a specific parcel – flood exposure, seismic activity, wildfire, and localized hazards like methane – before they become insurance problems, financing conditions, or construction change orders.
It’s a different question from zoning. Zoning tells you what you’re legally permitted to build. Hazard assessment tells you what’s physically and financially safe to build – and what it will cost to build it responsibly. A site can be zoned perfectly for a 40-unit building and still carry hazard exposure that changes the entire pro forma.
Why Hazard Risk Gets Skipped – and Why That’s Expensive
Hazard data isn’t hidden. FEMA flood maps, USGS seismic data, state fire hazard severity zones, and local methane overlays are all public. The problem is timing and fragmentation: each dataset sits in a different agency system, and the formal reports that surface them – Phase I Environmental Site Assessments, geotechnical studies – are typically ordered after a site is under contract, because they cost money and take time.
That sequencing means hazard exposure usually surfaces too late to negotiate price, and sometimes too late to walk away cleanly. The costs when that happens compound quickly:
- Financing conditions – lenders can require additional studies, reserves, or insurance riders once a hazard is flagged, delaying closing
- Insurance impact – flood and wildfire exposure can raise premiums significantly or, in some markets, make coverage difficult to obtain at all
- Construction cost surprises – retrofit or mitigation work discovered after design is underway is far more expensive than the same work priced into the original budget
- Permit delays – some hazard overlays trigger additional review (geotechnical sign-off, fire-hardening requirements) that wasn’t accounted for in the project timeline
None of this means a hazard-exposed site is a bad site. It means the risk needs a number attached to it before the offer goes in, not after.
A New Category of Tools Is Closing This Gap
The underlying problem has never really been that hazard data is hard to find – FEMA flood maps, USGS seismic records, and state fire severity zones are all public. The problem is that they live in separate agency systems, each with its own interface, and pulling them together for one parcel has traditionally meant hours of manual cross-referencing or a paid consultant engagement.
A newer category of AI-powered property intelligence platforms has emerged specifically to close that gap – pulling every relevant hazard dataset into one place and interpreting what it means for a specific parcel, instead of just displaying it. Several platforms now compete in this space, with real differences in how many hazard layers they actually track, how current the underlying data is, and how much genuine interpretation they do versus how much they leave for the developer to work out.
Archiwise.ai is one of the most comprehensive – built to screen every major hazard category for any parcel in the US, grounded in the same public data agencies use, and paired with an AI assistant that can answer specific compliance and cost questions rather than just surfacing a raw designation.
The rest of this guide walks through what a proper hazard screening process looks like in practice – using Archiwise as the working example.
The Hazard Categories Every Developer Should Screen
Flood Risk
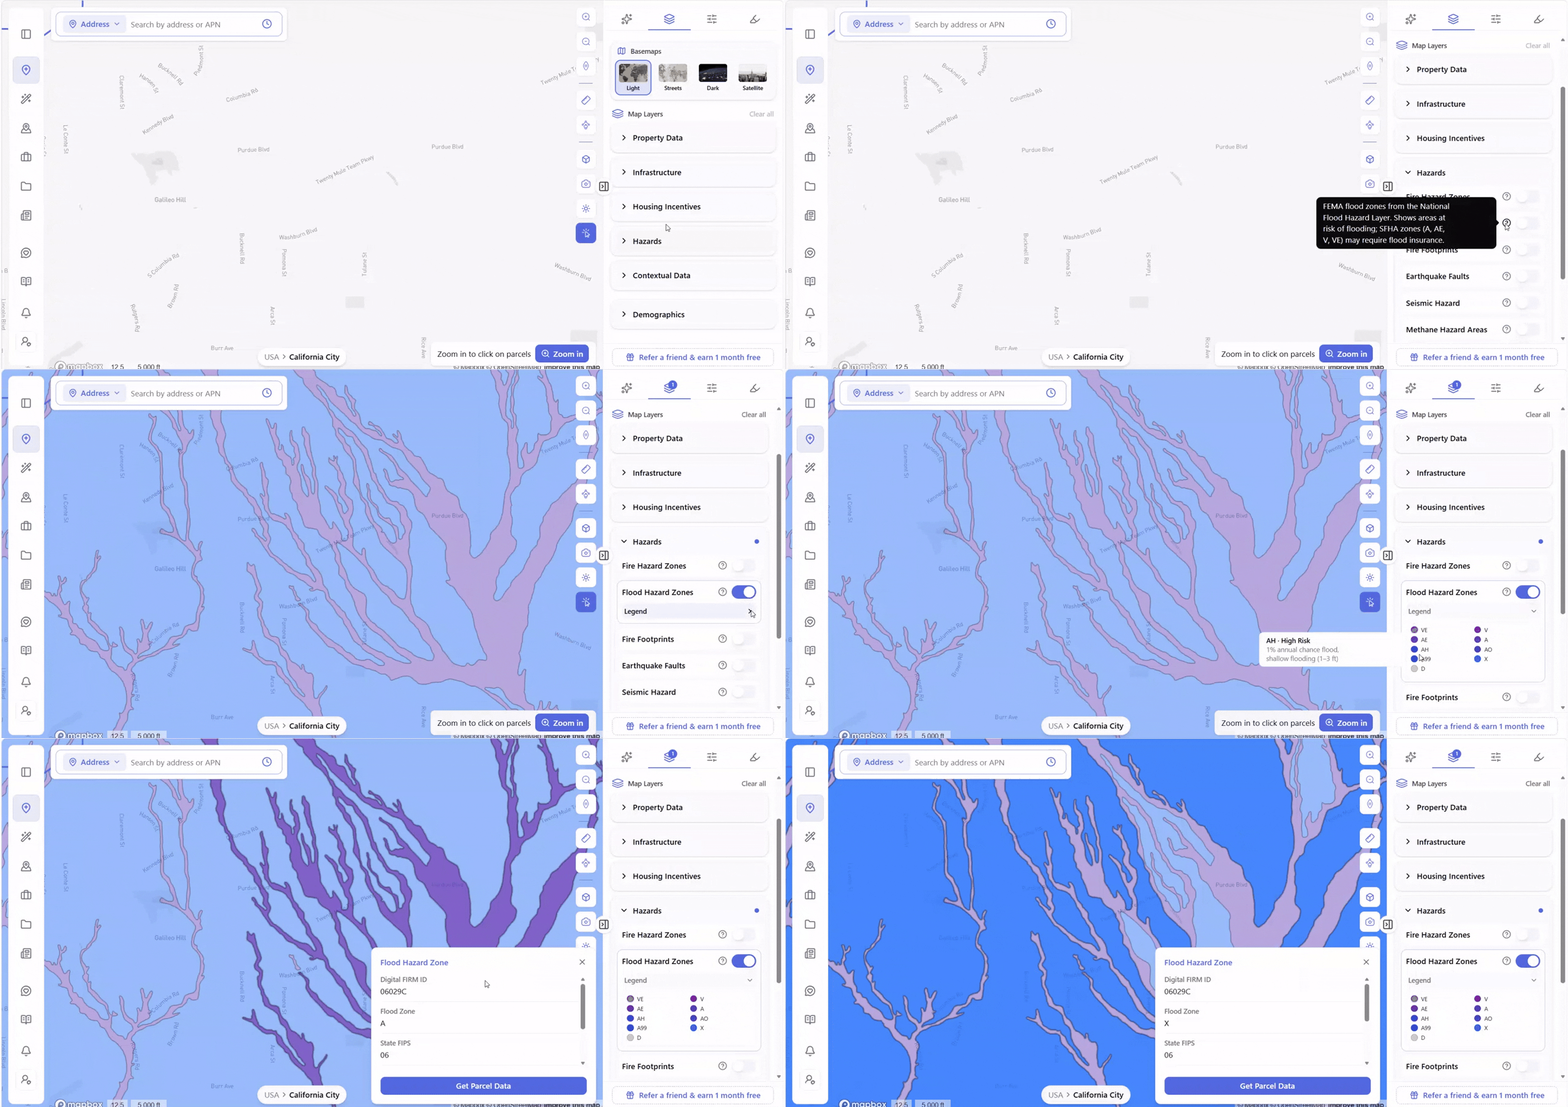
FEMA assigns every parcel a flood zone designation, sourced from the National Flood Hazard Layer (NFHL). Zone X is the best classification a property can receive – minimal flood hazard. The zones that actually change a project’s insurance and construction requirements are the Special Flood Hazard Area (SFHA) designations – A, AE, V, and VE – which indicate a 1% annual chance of flooding (the “100-year floodplain”) and typically trigger mandatory flood insurance for federally backed loans, along with elevation certificate requirements and, in some jurisdictions, floodproofing standards. Other designations (AH, A99, AO, D) carry their own specific conditions and are worth checking individually rather than assuming they behave like X or like an SFHA zone.
The designation isn’t just a box to check – it determines whether flood insurance is optional or mandatory, and how much that insurance costs over the life of the project.
Archiwise’s Flood Hazard Zones map layer pulls directly from the NFHL and color-codes every zone type on the map – from Zone X down through the SFHA designations – so a developer can see flood exposure across an entire watershed or neighborhood, not just confirm the designation for one address.
Seismic Hazard and Earthquake Faults
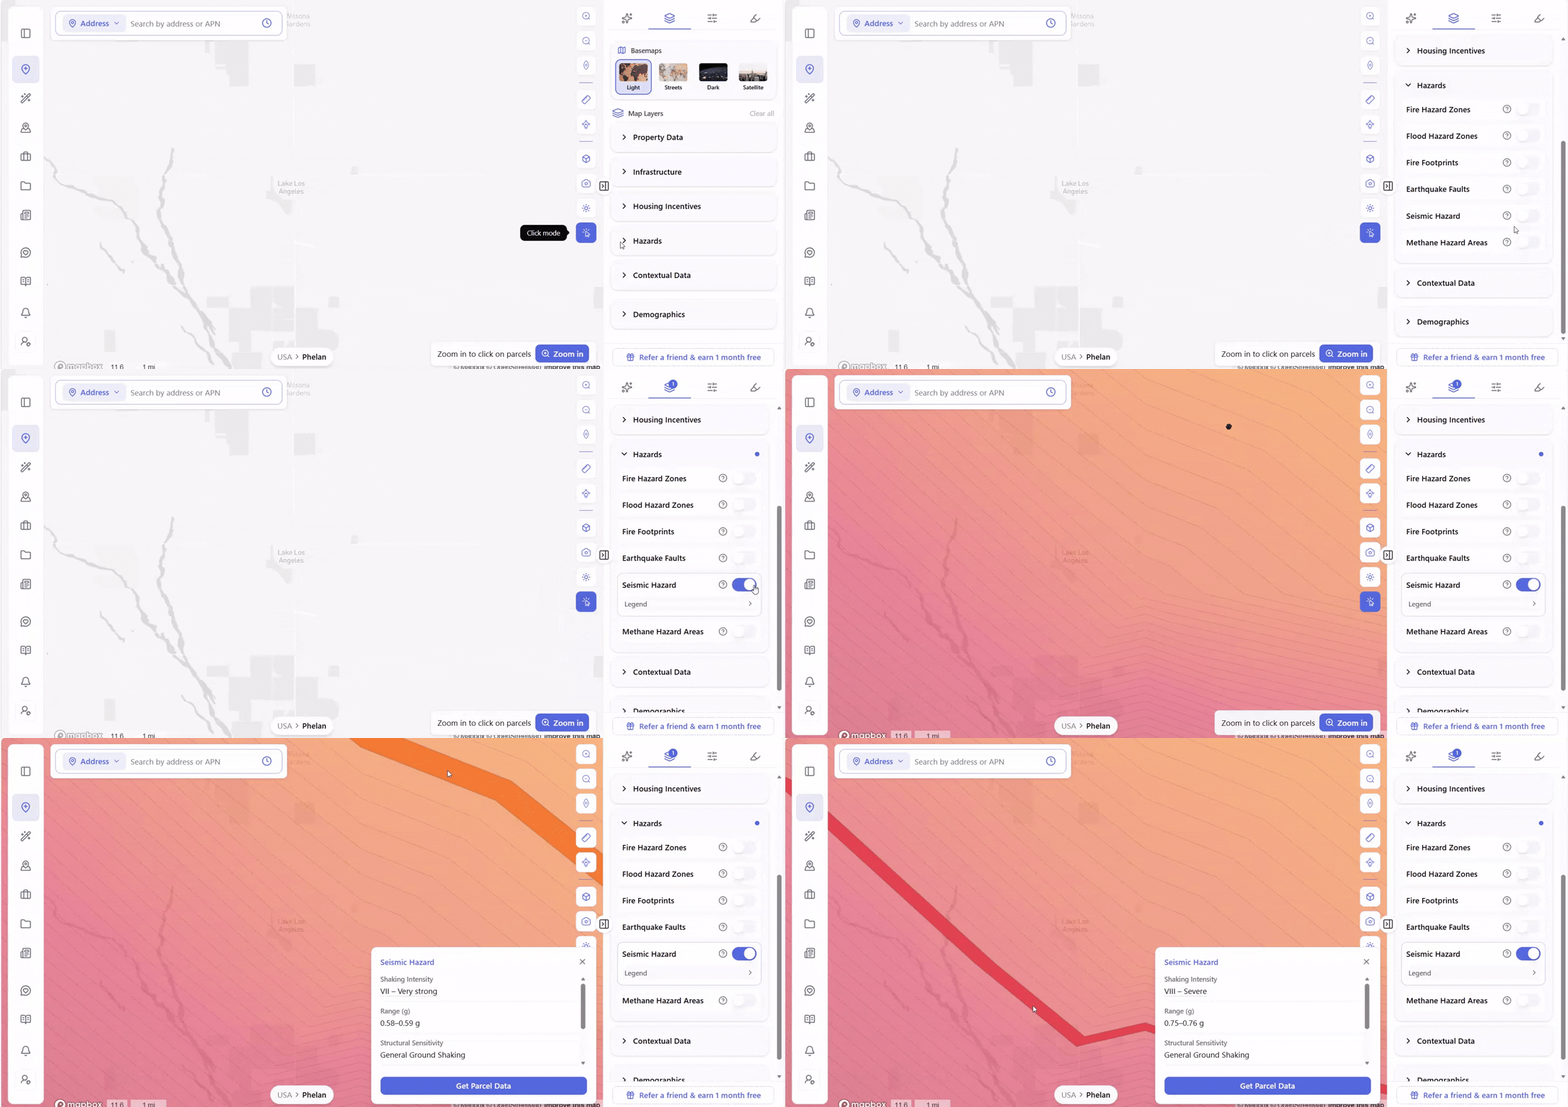
In seismically active regions, two separate questions matter: how close is the site to a mapped earthquake fault, and how intensely would the ground actually shake there in a major event. These aren’t the same data point. Fault proximity is about the fault itself – its age, classification, and slip rate. Shaking intensity is a different model entirely, based on USGS’s National Seismic Hazard Model (NSHM) and typically expressed on the Modified Mercalli Intensity (MMI) scale – ranging from “Weak” up through “Violent/Extreme,” each band tied to a peak ground acceleration range in g-force.
A site near a Class A fault with a “Severe” or “Violent/Extreme” shaking intensity isn’t automatically a no-go – but it does mean seismic design isn’t optional.
Here’s what that actually costs, based on published 2026 cost data for U.S. construction:
- Multifamily construction hard costs commonly run $200-$450/sq ft, varying significantly by market and building type (Willowdale Equity, 2026) – and in high-seismic regions, code-required seismic design (ASCE 7 SDC D) is factored into that rate rather than billed as a separate line item
- A geotechnical study – required before construction to confirm soil conditions and fault proximity – typically runs $3,000-$10,000 for a standard multifamily project (Angi; Engineer Fix), with complex or hillside sites running higher
- Retrofit work, if the geotechnical study reveals soft-story or other structural conditions, varies enormously by scope and building size: smaller measures like foundation bolting or cripple wall bracing typically run $3,000-$12,000 (Custom Home). A full soft-story retrofit on a multi-unit building is a much larger number entirely – the range varies too widely by building size, scope, and market to state a reliable benchmark here, so this one is worth pricing directly with a local structural engineer before it goes into a pro forma
What makes seismic risk manageable rather than disqualifying is that it’s offsettable. The specific programs vary by state, but the categories are consistent across high-seismic-risk regions: retrofit rebate programs administered at the state or local level (sometimes with federal funding support) that can cover several thousand dollars of the cost, low-interest state financing programs that can cover a substantial share of retrofit costs over extended terms, and in some states, property tax treatment that excludes seismic improvements from reassessment – meaning the retrofit itself won’t raise the annual tax bill. It’s worth checking what’s available in the specific state and jurisdiction before pricing the full cost into a deal.
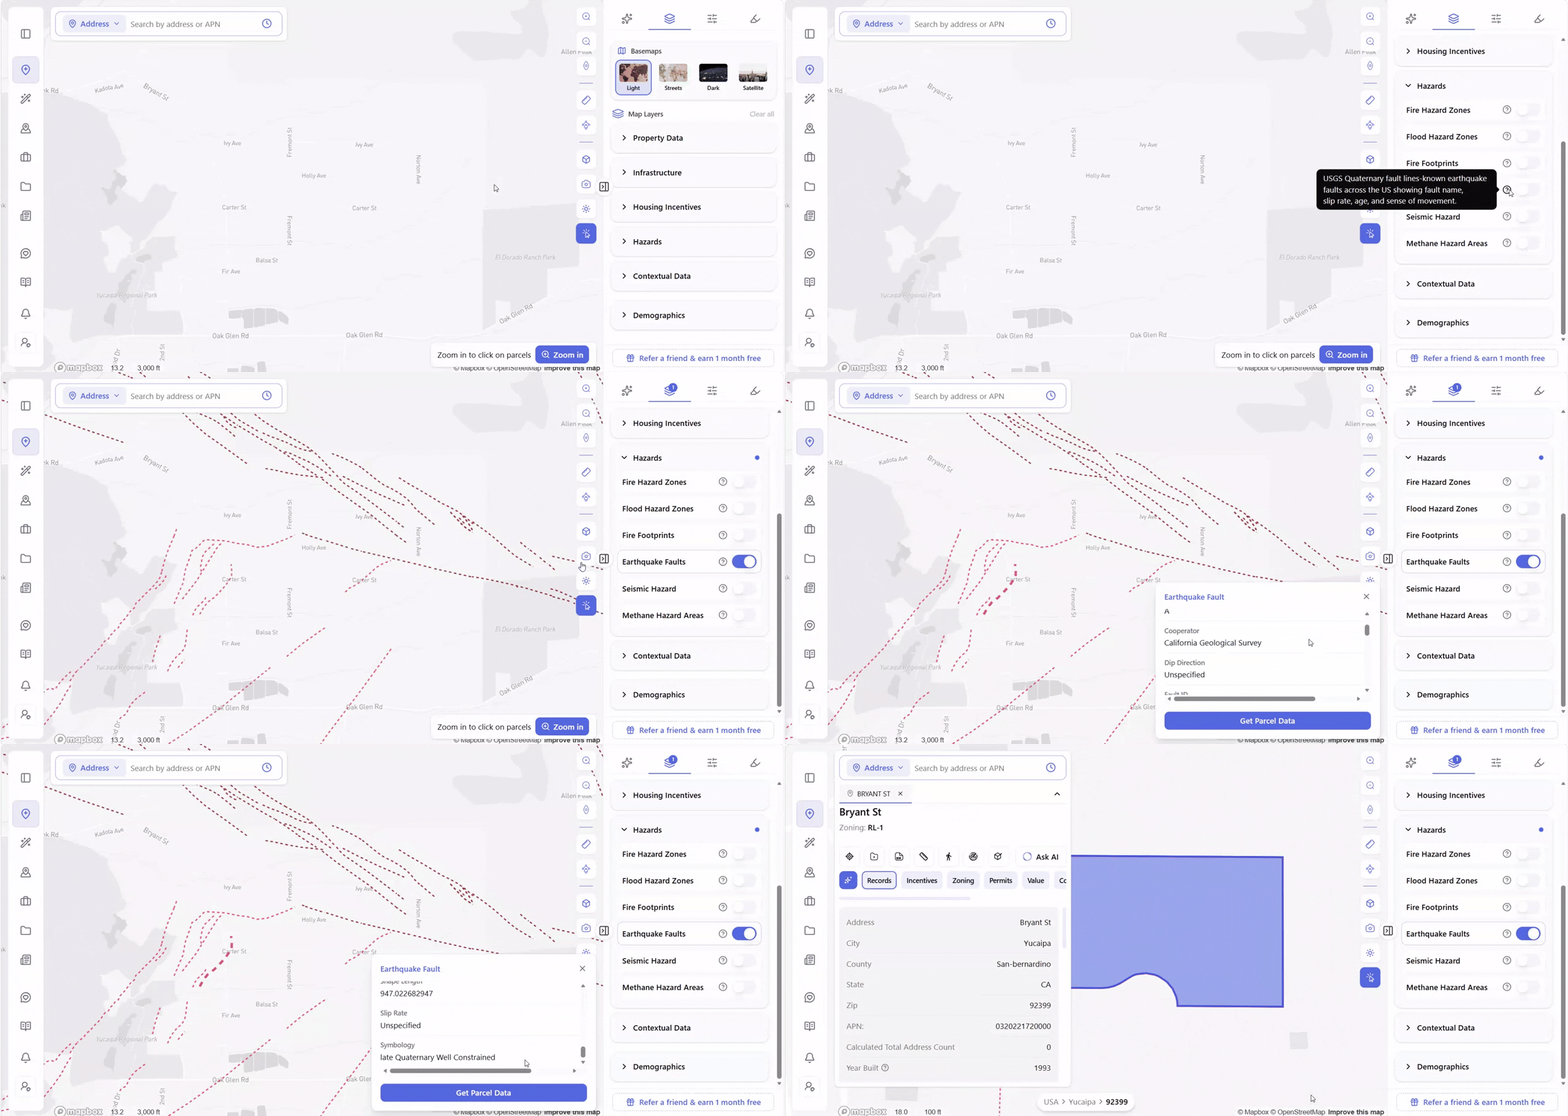
Archiwise tracks these as two distinct map layers, because they answer two different questions. Earthquake Faults plots USGS Quaternary fault lines – the same nationwide dataset used in every state – and clicking a fault line surfaces its name, age, classification, slip rate, sense of movement, and the geological survey that contributed the record. Seismic Hazard is a separate layer pulling from the USGS National Seismic Hazard Model, showing expected shaking intensity for the site on the MMI scale with a corresponding g-force range – and it’s adjustable, letting a developer factor in structural sensitivity, ground conditions, and a specific earthquake risk scenario to see how the estimate shifts. Together, the two layers tell you both how close a parcel sits to an active fault and how hard the ground would actually shake there.
Fire Hazard Zones and Fire Footprints
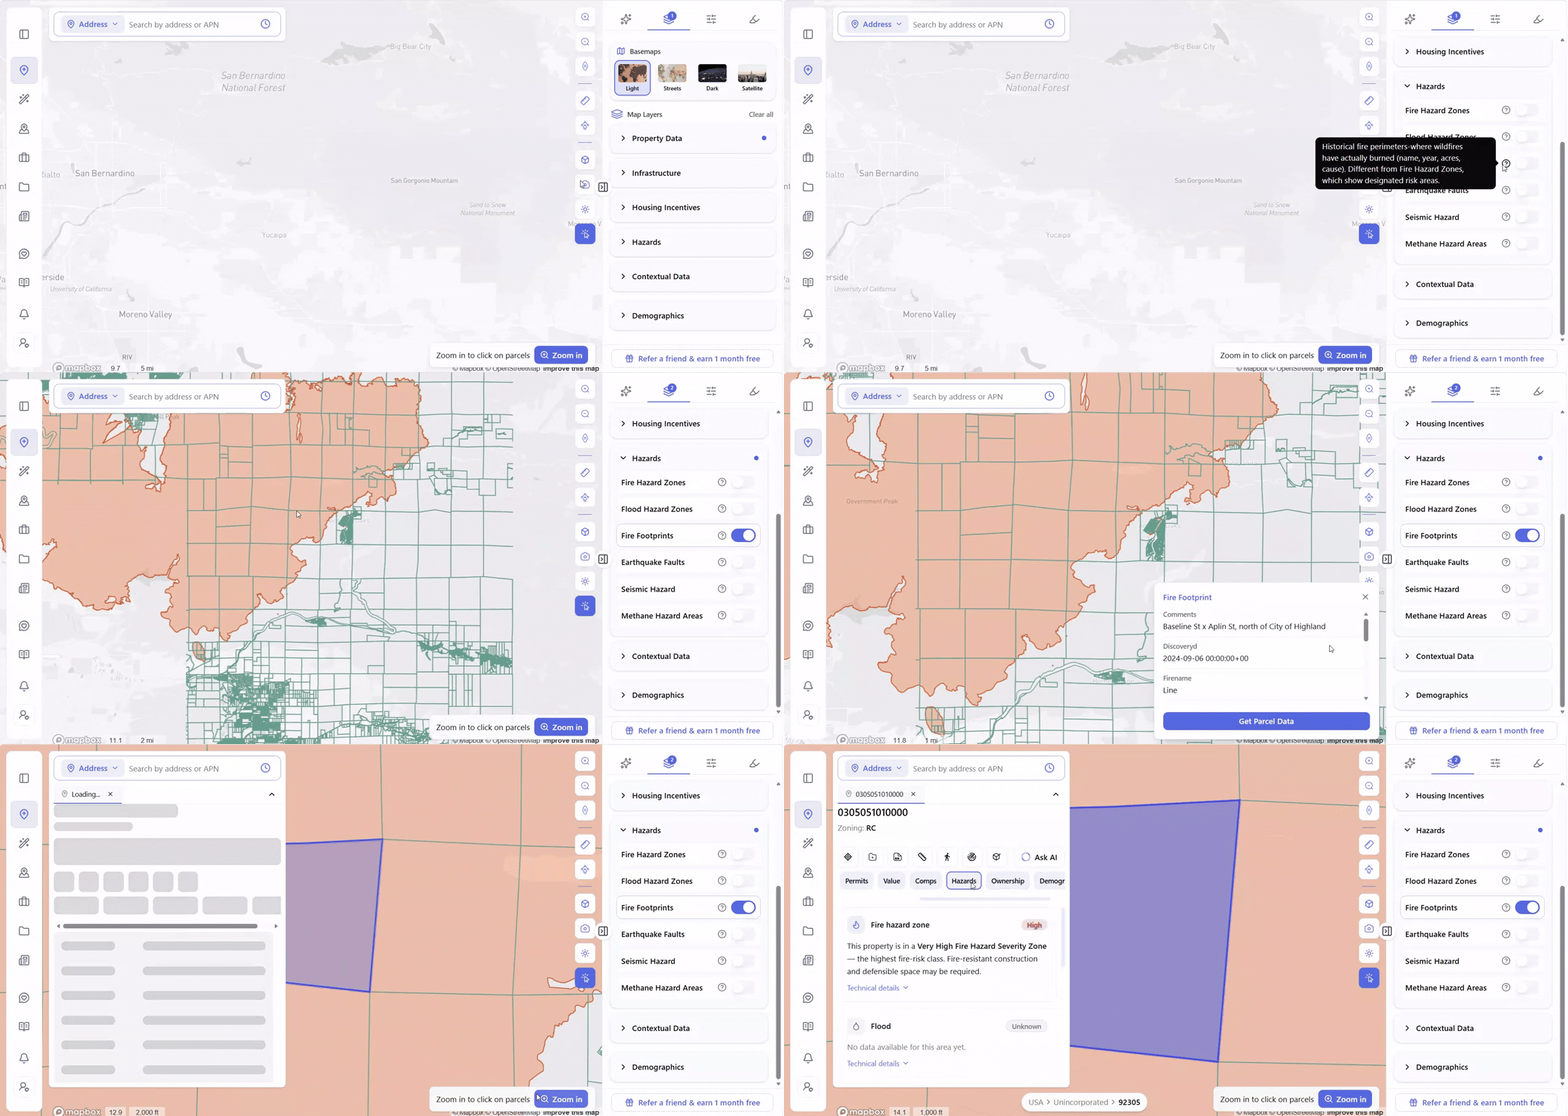
Fire hazard severity zones (mapped by state fire agencies) indicate the likelihood and intensity of wildfire exposure, and often come with building code requirements around defensible space, ember-resistant construction, and vegetation clearance. Fire footprint data – the historical record of where fires have actually burned – adds a second layer: zones with repeat fire history carry a different risk profile than zones that are simply modeled as high-risk but have no burn history.
Both matter for insurance. Wildfire exposure is one of the fastest-moving cost categories in property insurance right now, and in some high-severity zones, coverage availability itself has become the constraint – not just price.
Archiwise tracks these as two distinct layers, because they’re two different kinds of data. Fire Hazard Zones reflect the fire risk classification used by state and local fire agencies — California, for example, formally calls its version Fire Hazard Severity Zones (FHSZ) — regulatory boundaries that classify an area by fire risk (High, Moderate, and so on), independent of whether a fire has ever actually occurred there. Fire Footprints is a separate historical dataset entirely: actual burn perimeters from real wildfires, each with its name, the year it occurred, acreage burned, and cause. One tells you the regulatory risk classification; the other tells you what’s actually happened on the ground.
Methane Hazard Areas
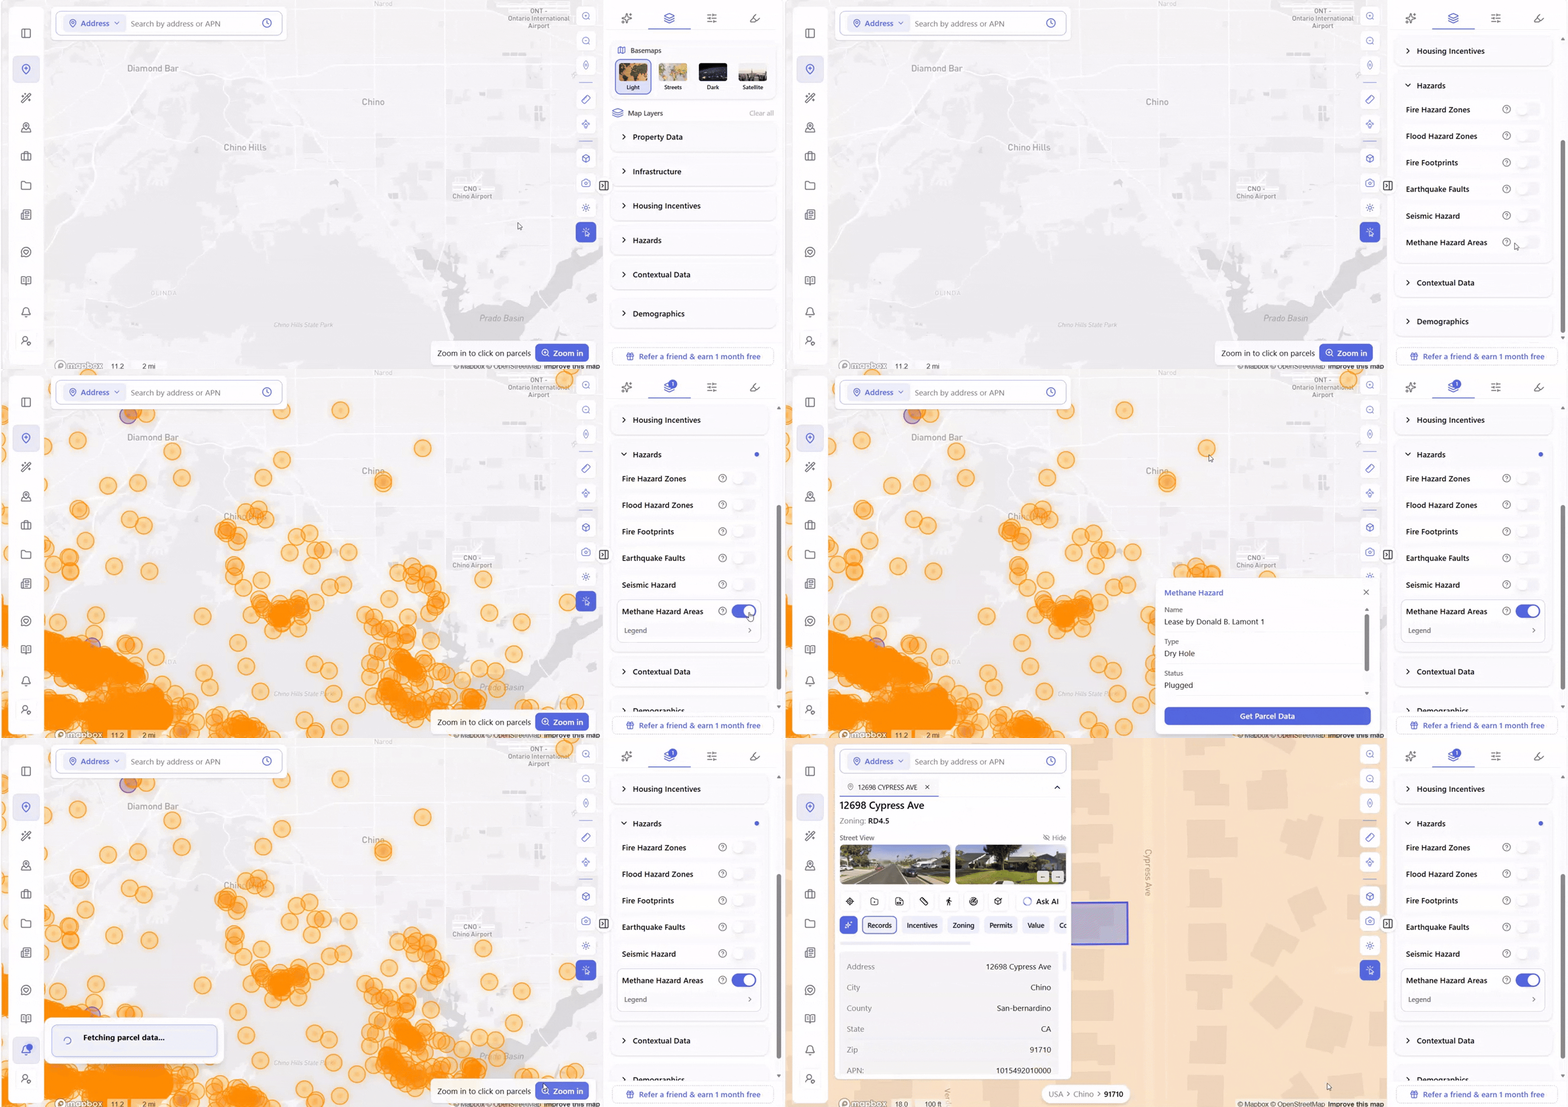
A more localized but often overlooked risk, especially in urban areas built over former oil and gas fields. Unlike flood or fire data, methane risk isn’t modeled as a broad zone – it’s tied to specific emission sources: oil wells, gas wells, and landfills, each with its own footprint of potential migration. Sites near these sources typically require mitigation systems – a subsurface barrier and venting system – built into the foundation design. It’s a real construction cost, but a predictable one once it’s identified early, rather than discovered mid-foundation-pour.
Archiwise’s Methane Hazard Areas layer plots each source as a point – color-coded by type (oil and gas, gas, or landfill) – with a half-mile buffer zone representing the area of potential methane hazard around it. Clicking a source surfaces its specific details: name, well type, and status (a plugged, dry-hole well carries a different risk profile than an active one, for instance). That level of detail matters, because “near a methane source” isn’t one uniform risk – a decommissioned well and an active landfill call for different levels of mitigation.
Every Hazard, on One Parcel: The Hazards Tab
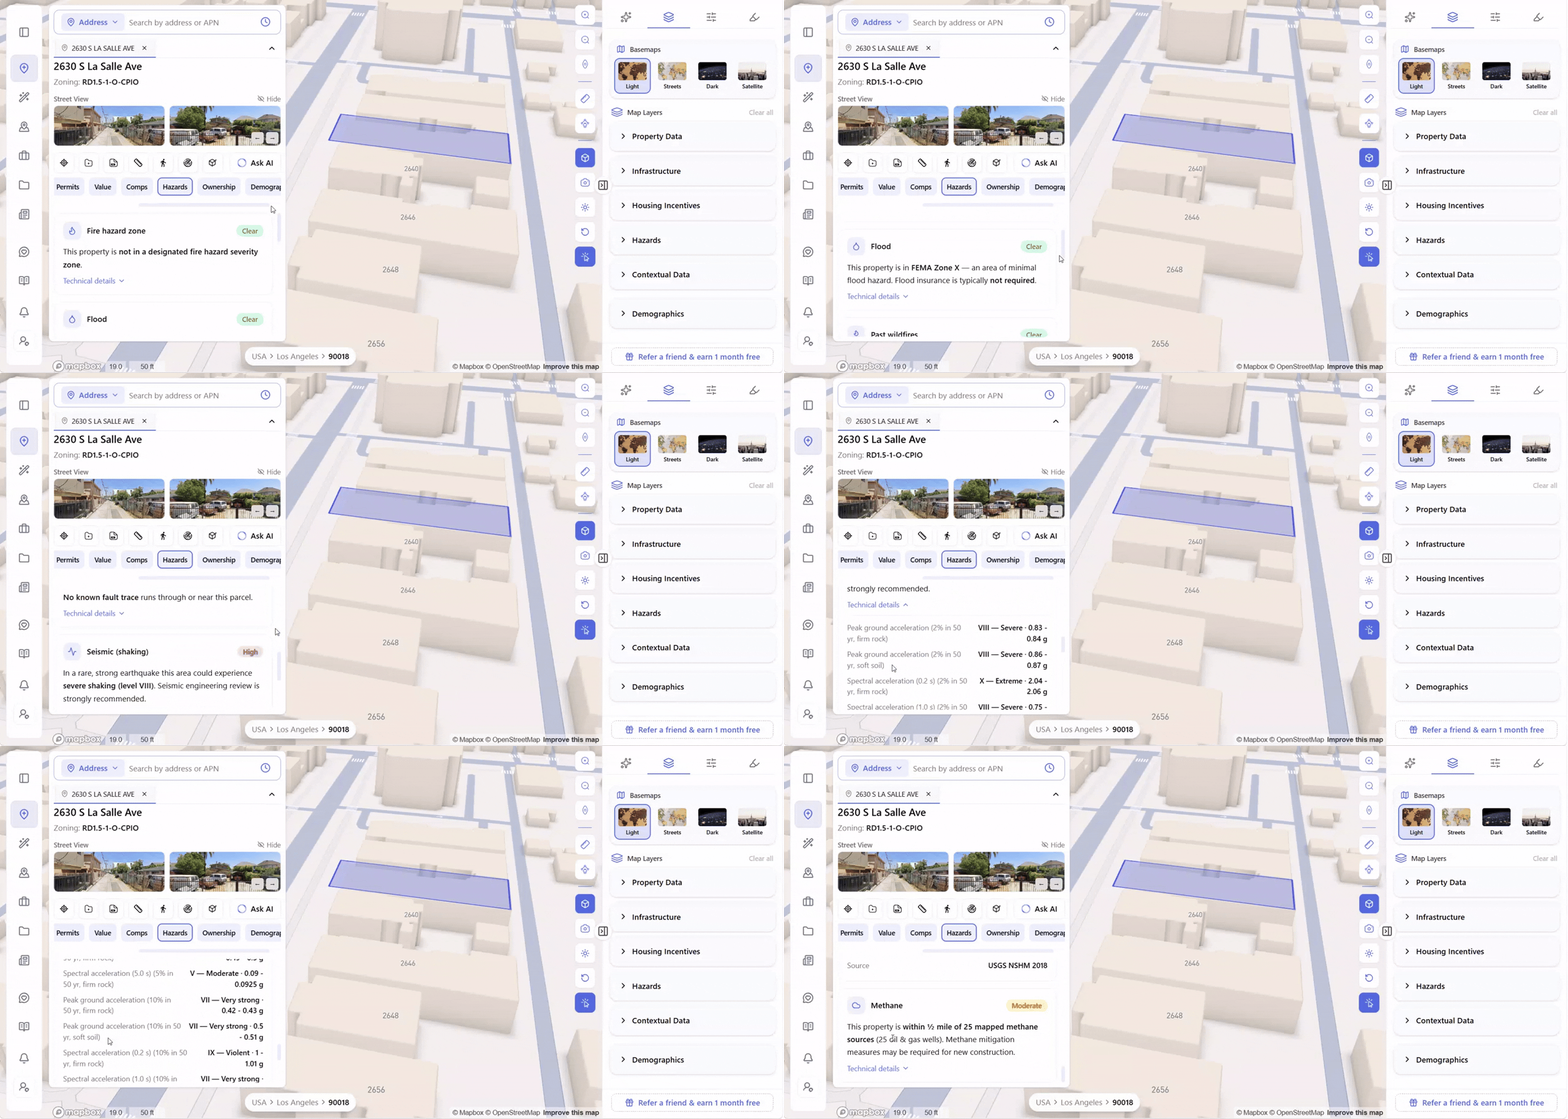
The map layers above are built for screening an area – seeing how a hazard type distributes across a neighborhood or corridor before narrowing down to specific parcels. Once a parcel is chosen, the question changes: what does this address actually face, across every hazard category at once?
That’s what the Hazards tab answers. It’s one of nine data tabs in Archiwise’s parcel info modal – alongside Records, Incentives, Zoning, Permits, Value, Comps, Ownership, and Demographics – and it mirrors all six hazard layers as individual cards for the specific parcel clicked. Each card carries a risk badge (Clear, Moderate, or High) and a plain-language read that cites the specific figure behind it. A seismic card rated High, for example, might read: “In a rare, strong earthquake this area could experience severe shaking (level VIII). Seismic engineering review is strongly recommended.” Every card expands into technical details for the underlying data.
That combination matters for how the tab gets used. The map layers are the screening tool – fast, visual, built for comparing many sites at once. The Hazards tab is the diligence tool – once a parcel is worth a closer look, it’s the complete hazard picture for that address in one place, without switching between six different layers to reconstruct it manually.
Screening Hazards the Old Way vs. With Archiwise
| Task | The Old Way | With Archiwise |
| Flood zone lookup | FEMA flood map viewer, one parcel at a time | Instant designation in the Hazards tab, alongside every other hazard data point |
| Seismic and fault data | USGS portal, separate fault maps, manual cross-referencing | Fault details and MMI shaking intensity surfaced on click, adjustable by scenario |
| Fire hazard zones | State fire agency portal, jurisdiction by jurisdiction | Fire Hazard Zones and Fire Footprints layered on the same map |
| Methane and localized hazards | Local agency records, often not digitized or easy to find | Emission sources plotted as points with buffer zones, each with type and status on click |
| Viewing hazards across an area | One hazard, one parcel, one lookup at a time | All six hazard layers toggled across an entire corridor or market at once |
How to Run a Hazard Risk Assessment in Under 15 Minutes
- Toggle the six hazard map layers on – Fire Hazard Zones, Flood Hazard Zones, Fire Footprints, Earthquake Faults, Seismic Hazard, and Methane Hazard Areas – to see exposure across the surrounding area, not just one parcel. Risk rarely respects lot lines – seeing how it distributes across a corridor tells you whether a site is an outlier or the neighborhood norm.
- Click any hazard feature on the map – a flood zone, a fault line, a methane source – for its specific detail: zone type, fault classification and slip rate, or a well’s name and status.
- Pull the full parcel picture. Clicking “Get Parcel Data” (or the parcel itself) opens the Hazards tab, where every hazard type for that address is shown as its own card, with a risk-level badge and a plain-language read.
- Ask the AI Zoning Expert for the compliance requirements and cost implications specific to that hazard and that jurisdiction, rather than reasoning from a general rule of thumb.
- Cross-reference offset programs. Seismic retrofit rebates, flood mitigation grants, and similar programs can meaningfully change the net cost of a hazard – they’re worth checking before the number goes into a pro forma.
- Price it into the offer, not into a future change order. A known, bounded hazard cost is a negotiating input. An undiscovered one is a liability.
What to Actually Do With the Data
Collecting hazard data isn’t the goal – pricing it correctly is. The distinction that matters isn’t “hazard present” versus “no hazard present.” It’s known and bounded versus unknown. A site in a severe seismic zone with a documented $3,000-$10,000 geotechnical study and a clear rebate pathway is a very different proposition than the same site discovered to have unknown soil conditions three weeks before permit submission.
That reframing changes how hazard data should be used at each stage:
- At offer stage – hazard exposure should adjust price or contingency terms, not just get logged in a due diligence file
- In design – known hazard costs, like seismic retrofit needs or flood-related elevation requirements, should shape the building program before architectural work begins, not get discovered mid-design
- In the pro forma – known mitigation costs and offsetting incentives belong as explicit line items, not buried in a contingency percentage
Common Mistakes in Hazard Risk Assessment
- Waiting until under contract. By the time a Phase I or geotechnical report is ordered, the negotiating leverage that hazard data provides is largely gone.
- Treating any exposure as an automatic no-go. Most hazard exposure in dense urban markets is manageable and priced into standard construction costs – the mistake is not quantifying it, not the exposure itself.
- Skipping the offset research. Rebate and financing programs for seismic and flood mitigation are underused simply because developers don’t know to look for them at the screening stage.
- Checking hazards one at a time. A site can look fine on flood risk and still carry serious seismic or methane exposure. The full picture only shows up when every hazard layer is checked together, for the same parcel.
Frequently Asked Questions
What’s the difference between a flood zone and a flood hazard area?
“Flood zone” is FEMA’s specific designation system (Zone X, Zone A, Zone AE, etc.), each carrying different insurance and building requirements. “Flood hazard area” is often used more generally to describe any zone with elevated flood risk – always check the specific FEMA designation rather than a general label.
Does a seismic hazard zone mean a project isn’t feasible?
Not usually. In seismically active regions, standard construction rates already price in code-required seismic design. The real cost to budget for separately is the geotechnical study, and additional retrofit work only if that study identifies a specific structural issue.
What hazards should every developer screen for at minimum?
Flood zone designation, seismic rating and fault proximity, fire hazard severity, and any localized hazards specific to the region (methane, for example, in areas with a history of oil extraction). Infrastructure proximity – gas pipelines, high-voltage transmission lines – is worth checking alongside these.
How much does hazard mitigation typically add to a project budget?
It varies significantly by hazard and jurisdiction, which is exactly why parcel-specific screening matters more than a general rule of thumb. As a benchmark: seismic geotechnical studies commonly run $3,000-$10,000, with further retrofit costs only if the study finds an issue.
Can hazard data affect financing?
Yes. Lenders can require additional studies, reserves, or specific insurance coverage once a hazard is identified, and unresolved hazard questions can delay or complicate closing. Surfacing this data before an offer avoids financing surprises later in the process.
The Bottom Line
Hazard risk isn’t a reason to avoid a site – it’s a number that belongs in the offer, not a surprise that shows up after one. The developers who move confidently through hazard-exposed markets aren’t avoiding risk; they’re pricing it correctly, earlier than everyone else.
A property intelligence platform like Archiwise puts every hazard layer – flood, seismic, fire, methane – in front of a developer the moment a parcel comes up, grounded in the same data agencies use, before a single dollar is committed.
See the full hazard picture before you make an offer.
Learn more
ArchiWise helps developers, investors, architects, and brokers go from address to decision in minutes, not weeks.
Whether you’re screening sites for multifamily development, evaluating zoning constraints, surfacing incentive eligibility like QCT and LIHTC, or assessing hazard risk before committing capital, ArchiWise runs every layer of analysis in one place.
Explore how ArchiWise helps teams screen development sites, analyze zoning, and make confident go/no-go decisions faster.