
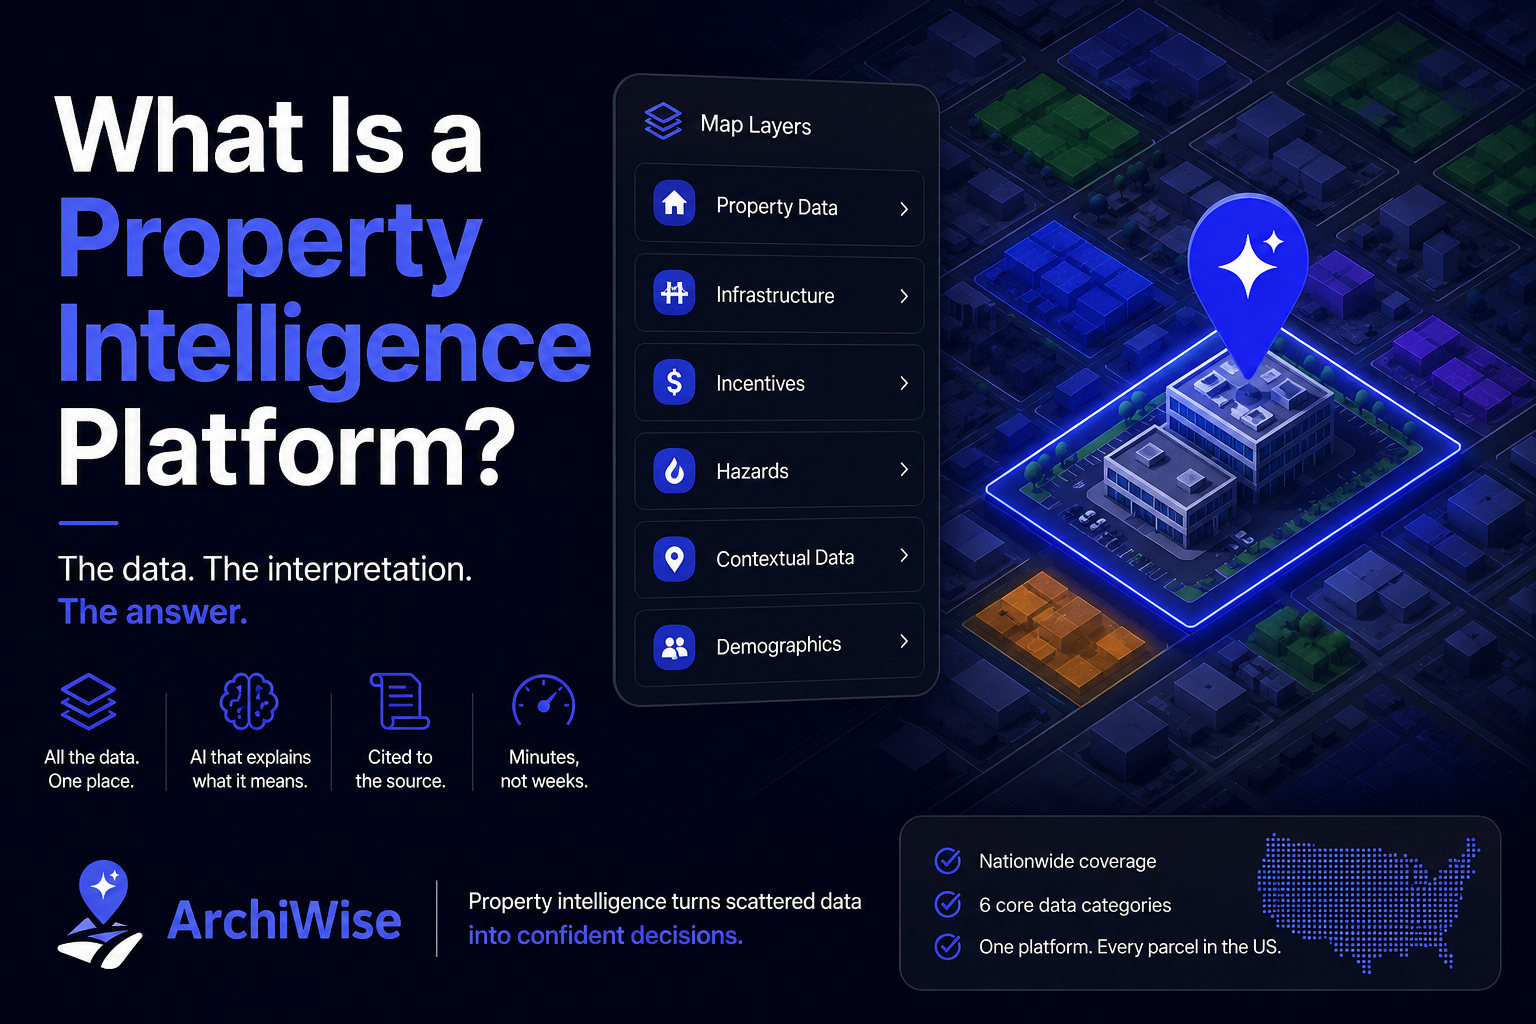

A parcel lands on your desk Monday morning. By Wednesday, you still don’t know if it’s worth an offer.
Not because the site is complicated – because finding out requires a county zoning map, a PDF of the municipal code, a FEMA flood viewer, an assessor’s portal, and a census tool, each with its own login and its own data format, stitched together by hand, parcel by parcel.
A newer category of software exists to close that gap: the property intelligence platform. Here’s what the term actually means, why real estate needed it, and how a platform like Archiwise puts it into practice.
What Is Property Intelligence?
At its core, property intelligence is the practice of pulling every dataset relevant to a parcel into one place, instead of leaving it scattered across separate agencies and systems, and interpreting it rather than just displaying it. It’s the difference between being handed a stack of documents and being handed an answer.
That distinction matters because most of the underlying data isn’t new or hidden. Zoning codes, flood maps, and ownership records have been public for decades. What property intelligence adds is the layer on top: connecting datasets that have always lived in separate systems, and explaining what they mean together, for one specific piece of land.
In real estate, that translates directly into speed and confidence in a decision. A question that used to take a consultant weeks and several thousand dollars to answer – can I build this, what will it cost, is there a market for it – can now be answered in minutes, before any money is committed to a site.
Why Real Estate Needed This
Real estate research has always been fragmented by design, not by accident. Zoning sits with the city. Flood data sits with FEMA. Fire hazard data sits with state and local fire agencies. Seismic data sits with USGS. Ownership records sit with the county assessor, often in a format that shows a name but not a mailing address. Every one of those systems was built to serve its own agency – not a developer trying to make one decision about one parcel.
The result: evaluating ten candidate sites meant ten separate research cycles, each eating hours or days, before a developer could even rank them against each other. By the time a site turned out not to work, the time – and often the money – was already spent.
This is the gap between a lookup tool and a property intelligence platform. A lookup tool – a county zoning map, an assessor portal, a FEMA viewer – shows you one dataset for one jurisdiction. A property intelligence platform combines them, and explains what they mean together, for the parcel in front of you.
A lookup tool hands you the zoning code. A property intelligence platform tells you what that code means for your project – and shows you exactly where in the ordinance it came from.
| Lookup Tool | Property Intelligence Platform | |
| Coverage | One dataset, one jurisdiction (a zoning map, a county assessor, a FEMA viewer) | Every relevant dataset for one parcel, not just one |
| Interpretation | Displays the raw code or designation | Explains what it means for the project, cited to source |
| Multi-site screening | Rarely – built for one address at a time | Filter, draw, or search hundreds of parcels at once |
| Jurisdictional range | Often one city or county | Nationwide, same workflow everywhere |
| Update model | Manual review of new ordinances | Continuously updated knowledge base |
A Category That’s Already Reshaping Real Estate
This isn’t a hypothetical shift. Many of the largest developers, homebuilders, and investment firms in the country are already running their land acquisition and site-selection process through platforms like this – screening zoning, environmental, and parcel data before making acquisition decisions, rather than after. When companies of that size change how they find land, it’s a signal that the category has moved well past early adopters.
A number of platforms now compete in this space, with real differences in nationwide coverage, how many data layers they actually cover, and how much genuine interpretation they do versus how much they leave for the user to figure out. Archiwise is one of the most comprehensive, and it’s a useful example of what the category looks like when it’s built to cover the whole picture – not just zoning, and not just one city.
Archiwise: Property Intelligence for Every Parcel in the US
Archiwise is a nationwide pre-development site analysis platform built for developers, investors, and architects, covering every parcel in the United States. Map layers let zoning, hazards, incentives, and demographics be visualized across an entire area before a single parcel is chosen. Clicking any parcel then opens a full site picture in one info modal, and an AI chat assistant sits alongside both, answering plain-language questions grounded in the data. Here’s how the pieces fit together.
Map Layers: The Same Categories, Across an Entire Area
Tabs answer questions about one parcel. Map layers answer a different question: how does this whole category look across a neighborhood, a corridor, or an entire market, before a single address is chosen? Archiwise organizes its map layers into six groups, each one toggled on directly over the map.
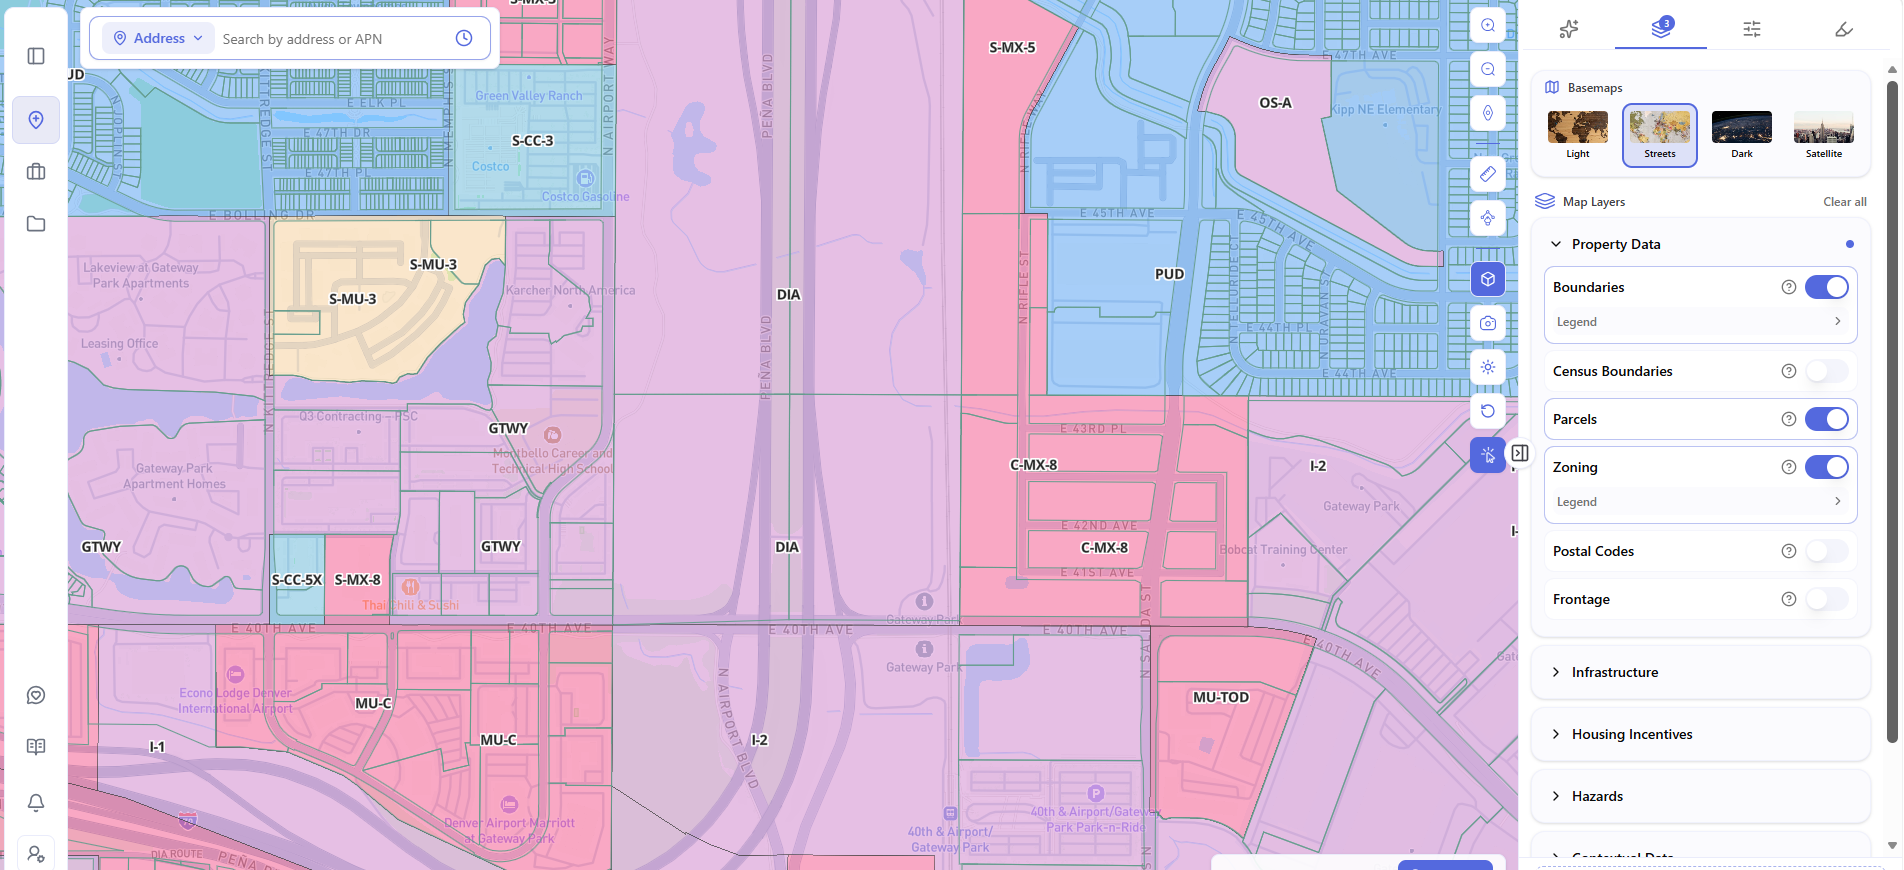
Property Data
Boundaries, Census Boundaries, Parcels, Zoning, Postal Codes, and Frontage. These are the base reference layers – jurisdiction outlines, parcel lines, and zoning districts color-coded by type – that give a developer the full zoning picture of an area before clicking a single parcel.
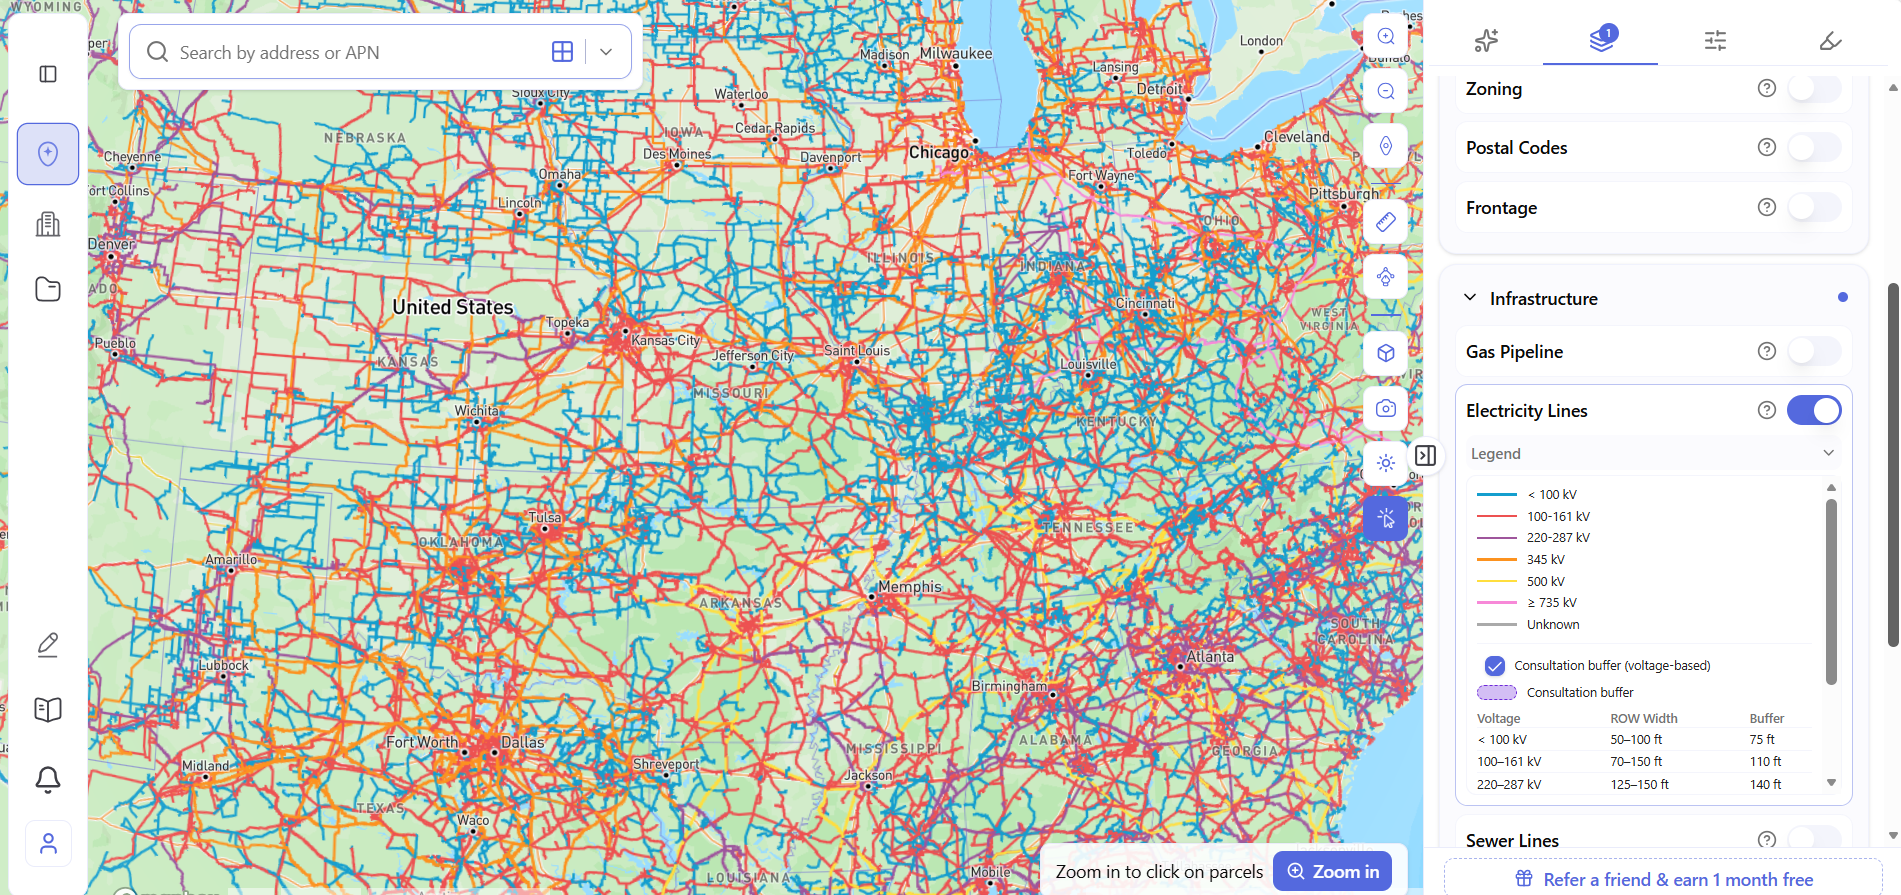
Infrastructure
Gas Pipeline, Electricity Lines, and Sewer Lines. Each utility layer comes with its own detail: the gas pipeline network is shown with a consultation buffer, electricity lines are color-coded by voltage with right-of-way widths noted, and sewer line coverage is shown where available. A conflict that would otherwise surface months into due diligence shows up at the screening stage instead.
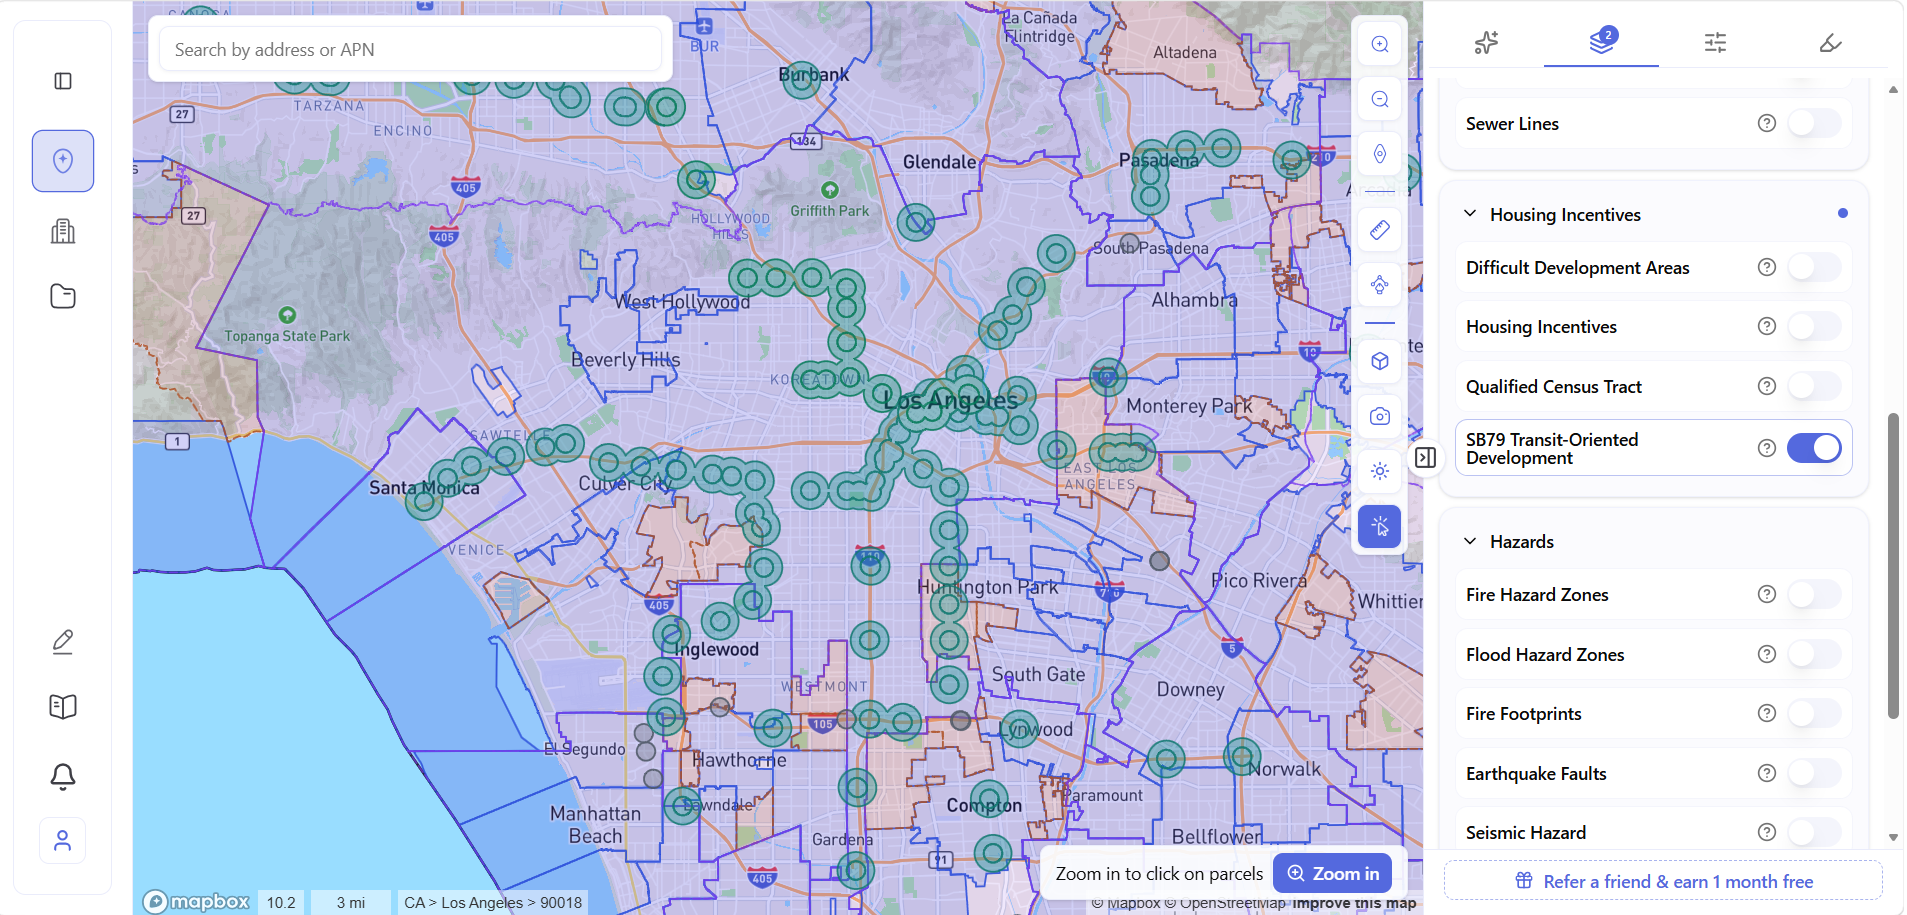
Housing Incentives
Difficult Development Areas, Low Income Housing, Qualified Census Tract, and SB79 Transit-Oriented Development. Instead of checking incentive eligibility one parcel at a time, these layers shade the qualifying zones directly on the map across an entire area, making it immediately visible where incentive-eligible land sits.
Hazards
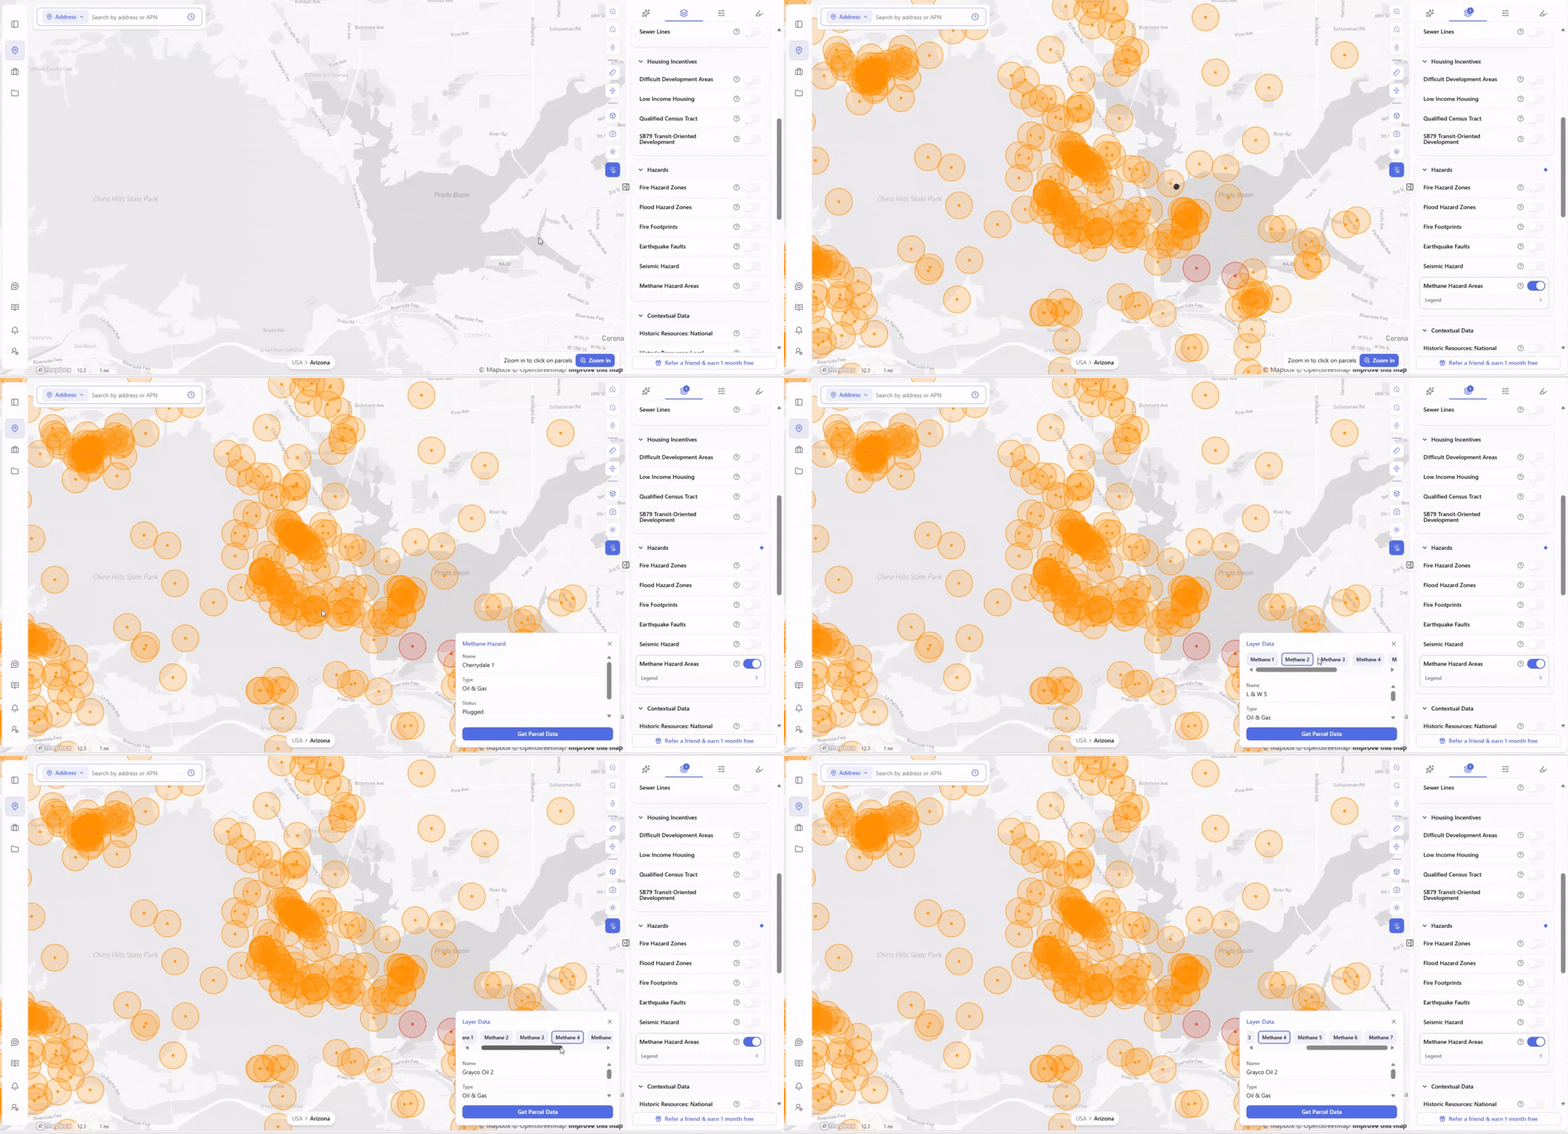
Fire Hazard Zones, Flood Hazard Zones, Fire Footprints, Earthquake Faults, Seismic Hazard, and Methane Hazard Areas. Turning these on shows how risk is distributed across a whole corridor or neighborhood, rather than confirming exposure for just one site at a time.
Contextual Data
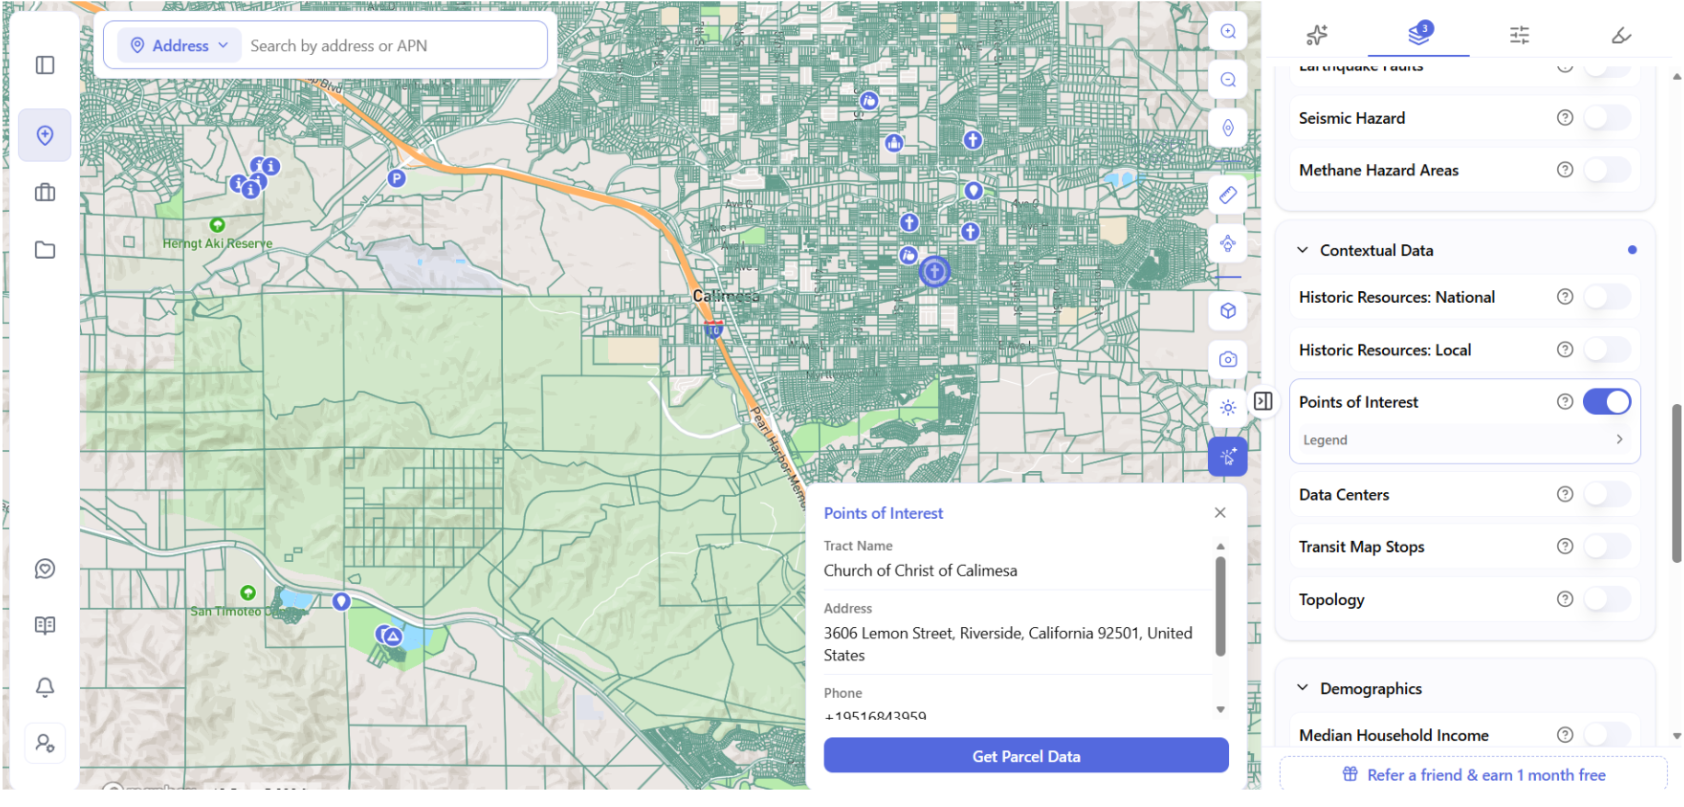
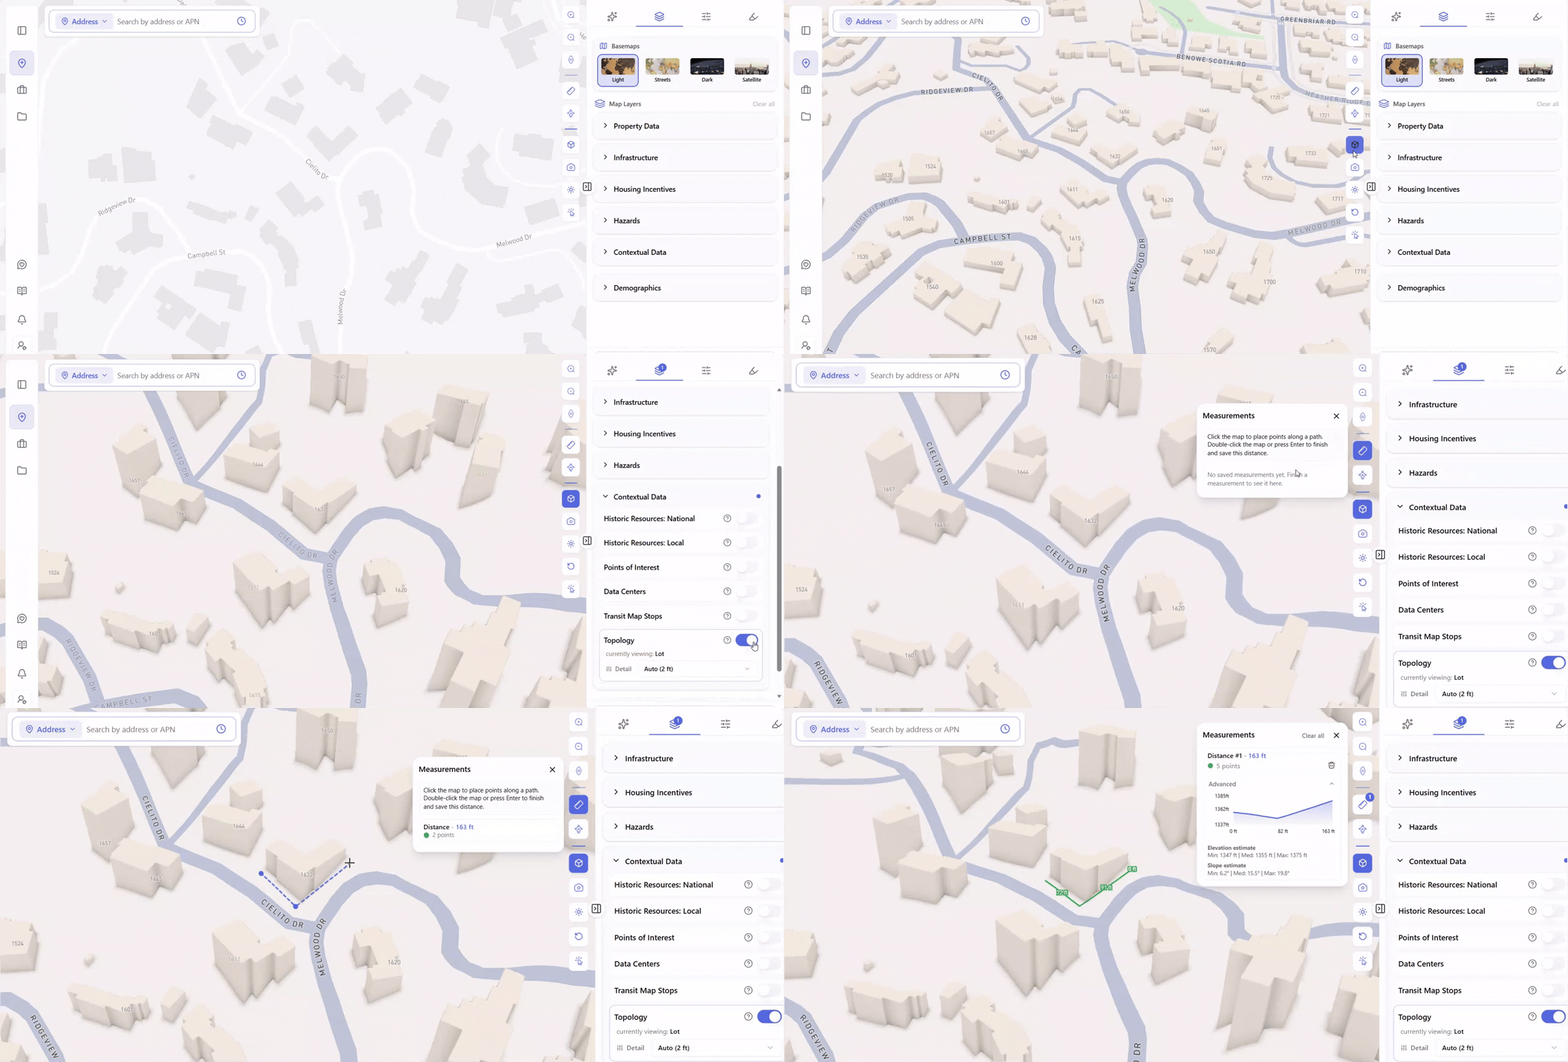
Historic Resources: National, Historic Resources: Local, Points of Interest, Data Centers, Transit Map Stops, and Topology. This is the neighborhood context layer group – historic designations that could trigger a preservation review, nearby points of interest and transit access, and terrain and topology for understanding the physical site.
Demographics
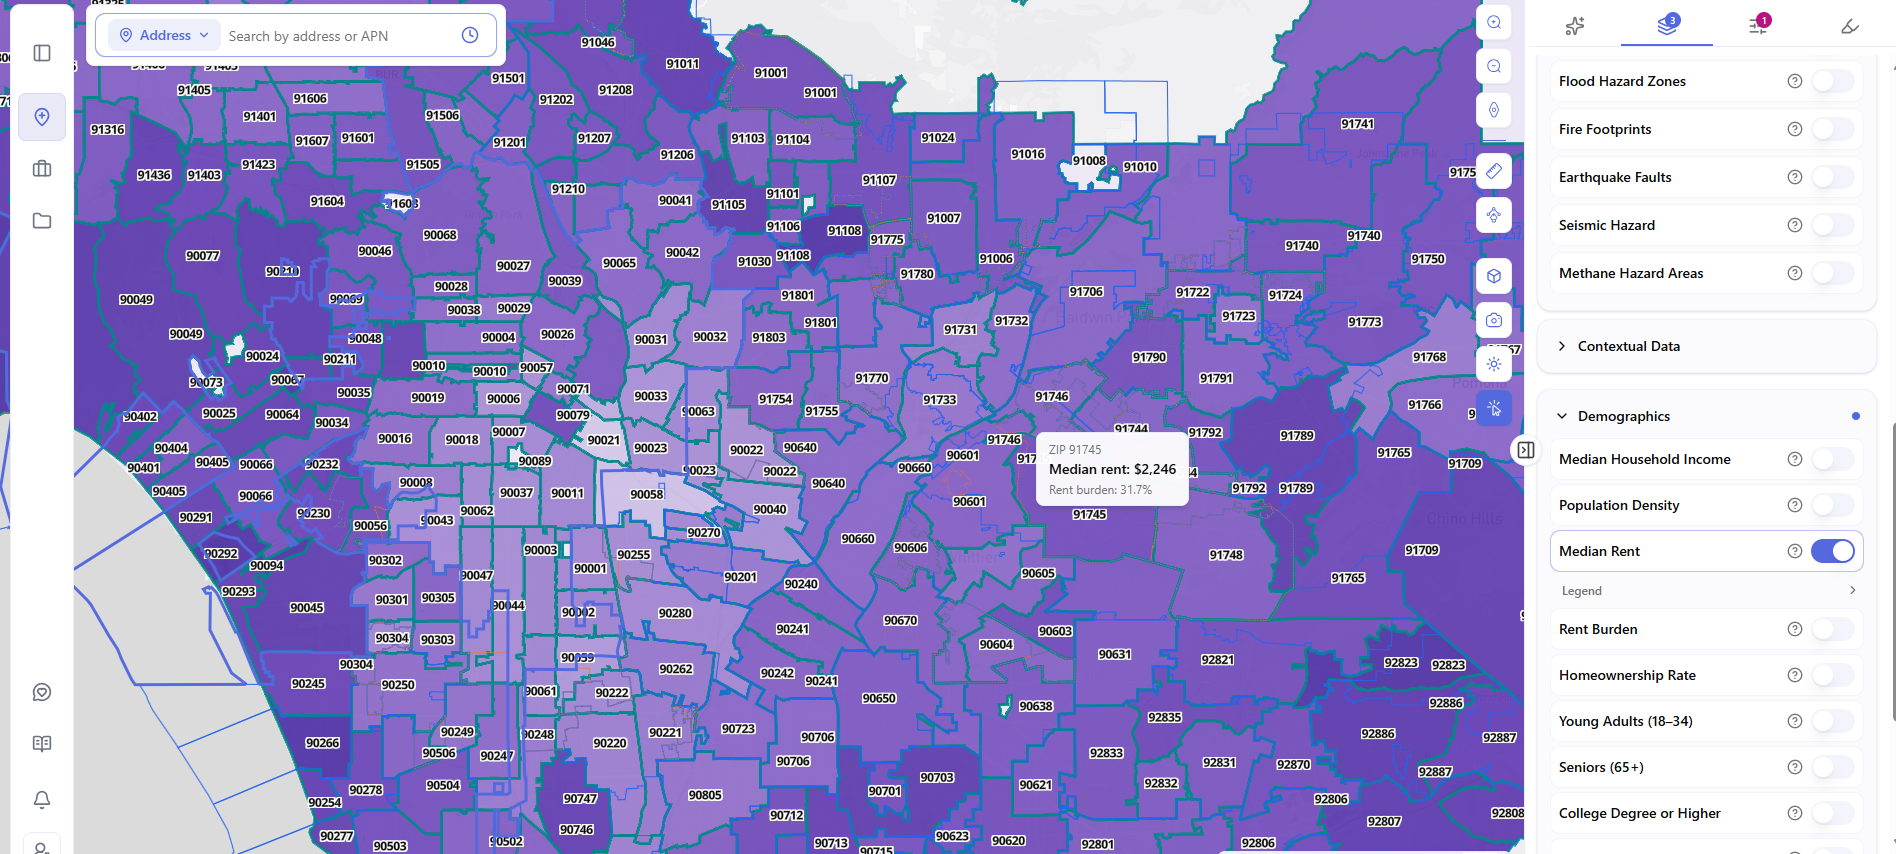
Median Household Income, Population Density, Median Rent, Rent Burden, Homeownership Rate, Young Adults (18–34), Seniors (65+), College Degree or Higher, Poverty Rate, Labor Force Participation, Unemployment Rate, and Six-Figure Households. The same categories the Demographics tab shows for a single parcel, visualized here as a map layer across an entire area – useful for spotting where market fit is strongest before narrowing down to specific parcels.
Besides these map layers, clicking any single parcel opens a complete site picture in one info modal: nine data tabs – Records, Incentives, Zoning, Permits, Value, Comps, Hazards, Ownership, and Demographics – covering every parcel in the country, in the same format everywhere. Ownership is one of the most useful of the nine: it surfaces owner name, ownership type, and mailing address the moment the tab opens, including the cases where the mailing address differs from the site address – the actual absentee-owner signal that matters for outreach – alongside a hold period and a Sell Candidate rating that scales with it.
AI Copilot: Interpreting Data, Not Just Retrieving It
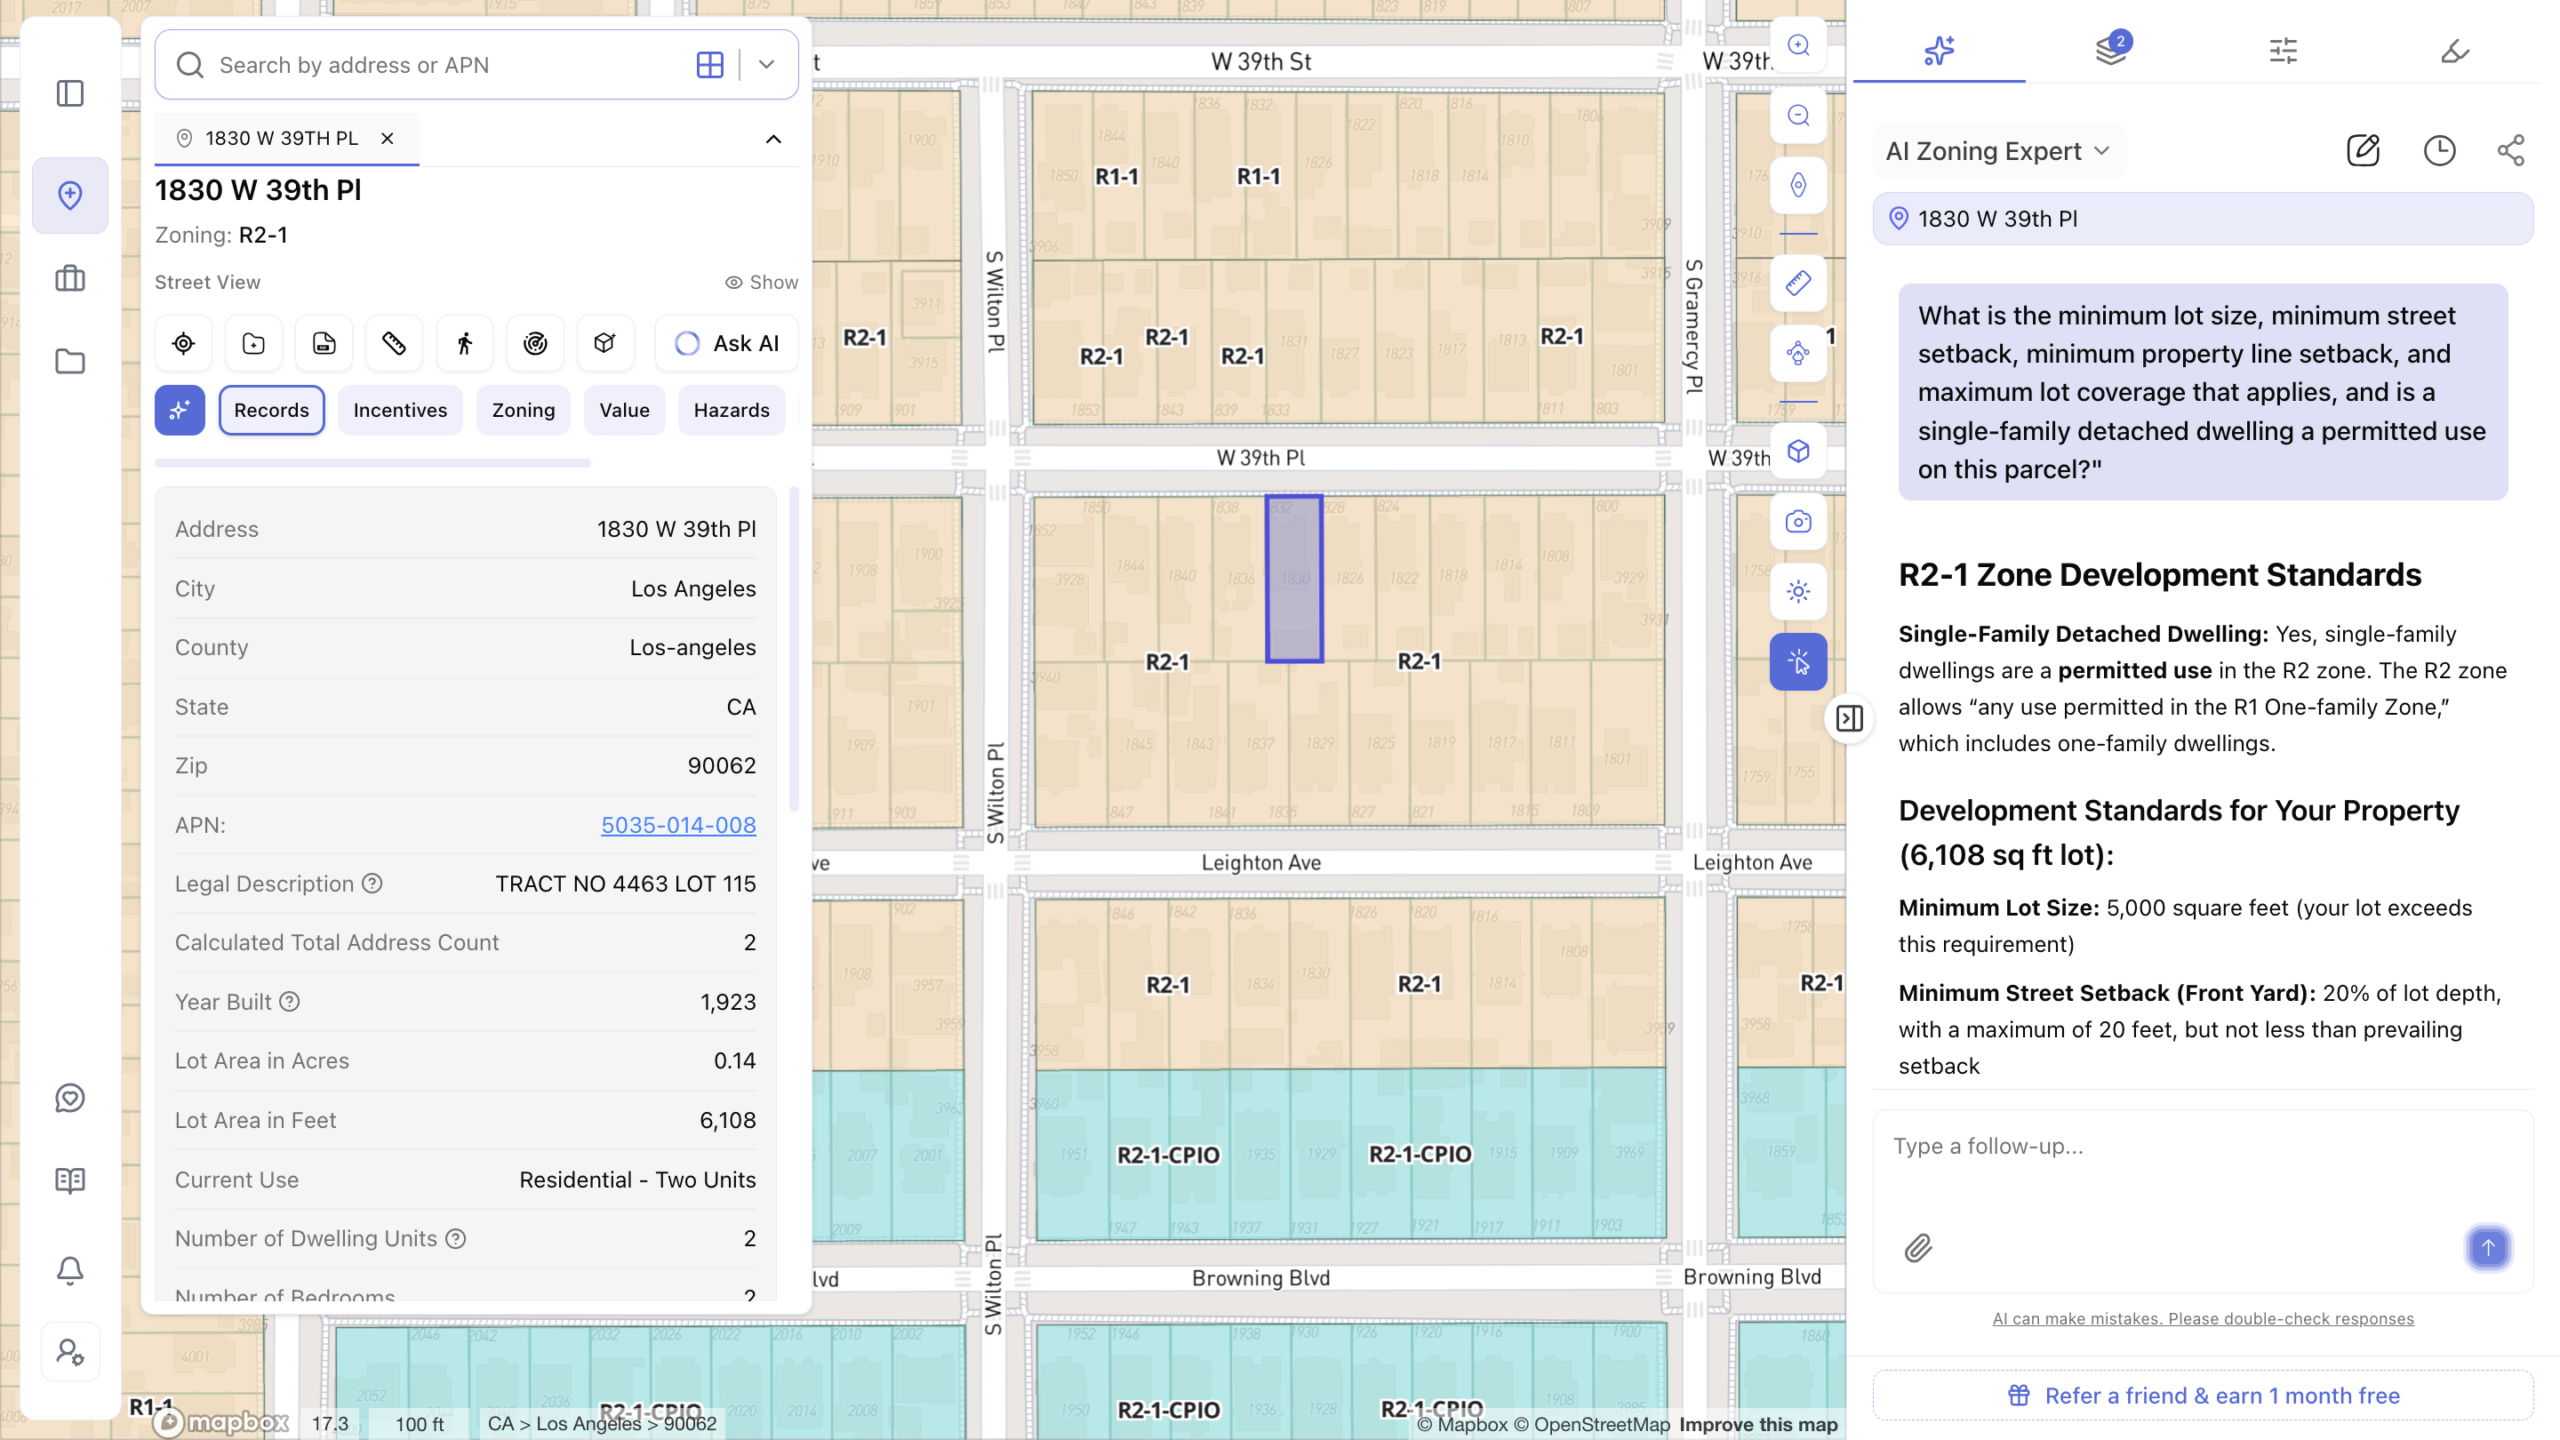
Most platforms show you data and leave you to make sense of it. Archiwise doesn’t stop there – its AI Copilot interprets that data, answering real development questions in plain English instead of handing back a field for you to decode.
Some of those questions are general: what does a density bonus mean under state law, how does a transit-oriented development bonus actually work, what triggers a discretionary review. Others are parcel-specific: what’s the maximum height allowed here, is multifamily permitted by right, can this lot be subdivided, can it be assembled with the parcel next door into a larger development site, is this parcel in a flood zone, who owns the lot across the street. Either way, the Copilot reasons through the answer instead of just retrieving a field.
And the answer is grounded in the real thing – the actual zoning code, specific plan, or other official planning document that governs it, not a general description of what’s typical for a zone like this. The source is never hidden, either: every answer comes with a citation you can open and check for yourself.
The same Copilot also works at the scale of an entire search area, not just one parcel. Describe what you’re looking for in plain language – a lot size and zoning type paired with a density-bonus scenario, say – and it applies the matching filters across a drawn area and returns every parcel that fits, instead of making you set each filter by hand.
That’s the real advantage: a platform that doesn’t just show the data, but interprets it – one Copilot, every development question, whether you’re looking at a single parcel or an entire market.
Beyond One Parcel: Screening and Sourcing at Scale
A platform limited to one address at a time is still just a faster lookup tool, no matter how much data it packs into that one view. This is where Archiwise’s real site-selection advantage shows up: the ability to screen dozens or hundreds of parcels at once, without needing a single known address to start from.
The Draw Search Area tool lets a developer draw a polygon directly on the map – or filter by the current map view, a zip code, or a city – and set a buy box before a single address is in hand.
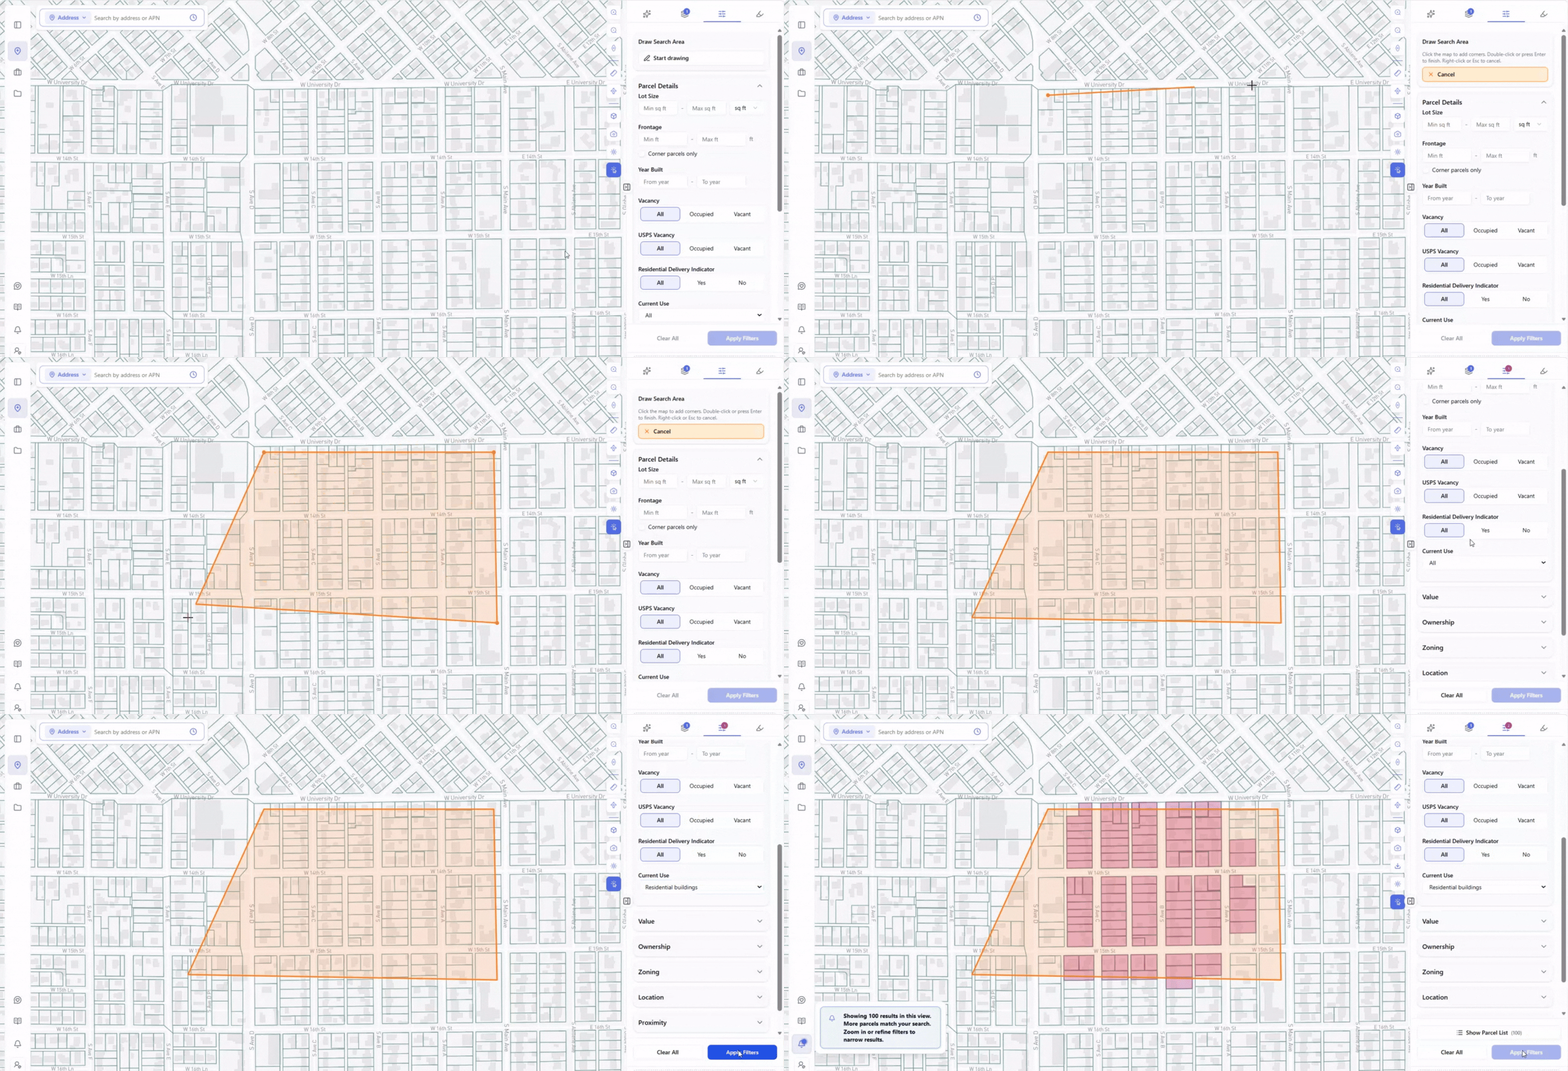
The filter panel covers Lot Size and Frontage (with a corner-parcels-only toggle), Year Built, Vacancy and USPS Vacancy status, a Residential Delivery Indicator, and Current Use broken into eight explicit categories – residential buildings, commercial buildings, public assembly structures, institutional or community facilities, transportation-related facilities, utility and other nonbuilding structures, specialized military structures, and sheds, farm buildings, or agricultural facilities. On top of that sit Value, Ownership, Zoning, Location, Proximity, and Demographics filters, all stackable together, all updating the map live as they’re applied.
Ownership deserves particular attention on that list – it’s often the single most valuable filter for anyone sourcing off-market deals. Instead of confirming who owns one parcel at a time, the Ownership filter narrows an entire drawn area down to the owners actually worth approaching first: institutional or government holders, absentee owners whose mailing address differs from the site address, or long-held properties that pair with a strong Sell Candidate rating. That turns a promising single site into a real outreach list across a whole market – the difference between finding one deal and building a pipeline.
That level of filtering – vacancy status, ownership type, and demographics in the same pass – is the difference between a map that shows data and a map that actually finds sites. Results can be switched to a list view or exported, turning what used to be hours of manual cross-referencing into a single connected flow.
The same screening also works in plain language. Rather than setting each filter by hand, Archiwise’s AI chat takes a natural-language brief – something like a lot size and zoning type paired with a density-bonus scenario – and applies the matching filters itself, returning the parcels that fit. It’s the same AI that answers single-parcel questions, extended to screen an entire search area at once.
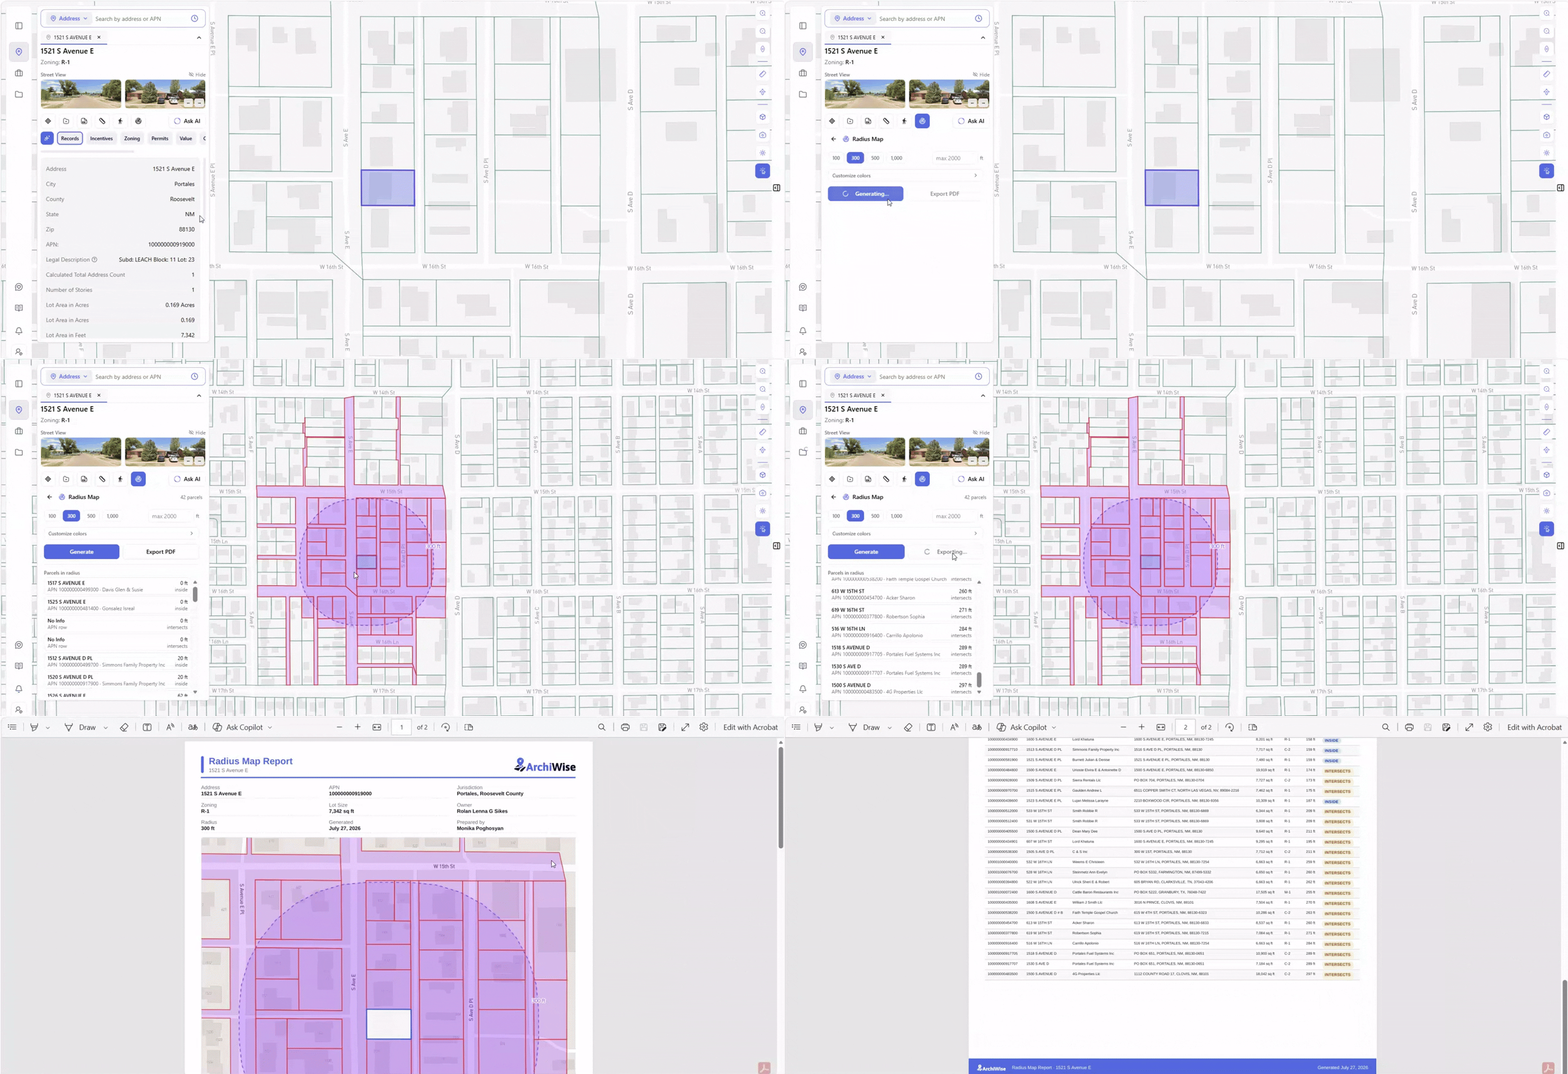
- Radius Map tool – generates the ownership table required for CUP, variance, or zone-change hearing notifications at whatever distance a jurisdiction requires, which doubles as an instant prospecting list for every owner around a site worth watching.
- Multi-parcel assemblage – combine up to five adjacent parcels into one view with merged lot area, value, and zoning, and ask AI-grounded questions about the assemblage as a whole – whether a use is permitted, what merger requirements apply, and what constraints affect the combined site.
- 3D elevation and slope measurement – drop points along a path directly on the terrain and get distance, elevation change, and slope readings back, useful for spotting grading costs or hillside constraints before design work begins.
Archiwise’s AI Zoning Expert vs. General AI
Developers increasingly try ChatGPT, Claude, or Gemini for exactly this kind of question. General AI tools are genuinely useful for a lot of real estate research – just not this part of it.
General AI can:
- Explain what a flood zone, FAR, or QCT designation typically means
- Describe how a CUP process or title search generally works
- Reason through a hypothetical development scenario you describe to it
General AI cannot:
- Tell you the current zoning designation for a specific address, right now
- Tell you who owns a specific parcel or where to reach them
- Confirm a parcel’s FEMA flood zone, fault proximity, or seismic rating
- Generate a filtered list of every matching parcel in a drawn area
- Tell you what can actually be built on a specific parcel by right
- Tell you whether a parcel can be subdivided, or assembled with adjacent parcels, into something larger
- Tell you whether a specific site is actually a good development opportunity or not
General AI can explain what a flood zone is. It has never seen the FEMA designation for your parcel – and without a live connection to that data, it never will.
The gap is live, document-grounded data. A general AI model draws on its training data; it has never seen the county recorder’s database, the current zoning ordinance, or this week’s FEMA update for the parcel you’re asking about. Archiwise’s AI Zoning Expert is grounded in the documents themselves, retrieved and cited in real time, for the specific parcel you’re asking about.
Frequently Asked Questions
What is a property intelligence platform?
Software that combines all the datasets needed to evaluate a specific parcel into one view, and increasingly interprets that data using AI grounded in the actual planning documents and public records for that parcel, rather than just displaying it.
How is a property intelligence platform different from a zoning lookup tool?
A lookup tool like a county zoning map, an assessor portal, or a FEMA map viewer shows you a designation or a map layer for one dataset, usually in one jurisdiction. A property intelligence platform combines multiple official datasets nationwide and explains what they mean for the specific parcel, citing its sources.
Is Archiwise the only property intelligence platform available?
No. Several platforms now serve this space, at very different scales – including large enterprise deployments already in use at some of the biggest homebuilders and real estate investment firms in the country. They vary in nationwide coverage, how many data tabs and map layers they include, and how much of the analysis is genuine interpretation versus raw data display. Archiwise is built to cover the full picture – zoning, hazards, incentives, ownership, demographics, and value – for any parcel in the US.
Can I use ChatGPT or Claude instead of a property intelligence platform?
General AI tools can explain zoning concepts and reason through scenarios you describe to them, but they have no live connection to county records, current zoning ordinances, or FEMA data. They can’t tell you the zoning, ownership, or hazard exposure for a specific parcel today – a property intelligence platform like Archiwise is grounded in the live data itself.
What data should a property intelligence platform include, at minimum?
Zoning and entitlement data, hazard and environmental risk, incentive and subsidy eligibility, ownership and mailing-address data, neighborhood demographics, and assessed value – for any parcel, not just the ones already listed for sale.
The Bottom Line
“Property intelligence platform” is a real, and increasingly crowded, category – not just a rebrand of the zoning map. The tools that actually earn the name combine every relevant dataset into one parcel view, interpret that data with sources cited, and let a developer screen an entire market instead of one address at a time.
Archiwise is built to clear that bar for every parcel in the US – and it’s worth checking any platform claiming the category against the same standard before trusting it with a real acquisition decision.
See your next site the way a property intelligence platform sees it.
Learn more
ArchiWise helps developers, investors, architects, and brokers go from address to decision in minutes, not weeks.
Whether you’re screening sites for multifamily development, evaluating zoning constraints, surfacing incentive eligibility like QCT and LIHTC, or assessing hazard risk before committing capital, ArchiWise runs every layer of analysis in one place.
Explore how ArchiWise helps teams screen development sites, analyze zoning, and make confident go/no-go decisions faster.